
How to Read a 10-K
12 areas of the 10-K to focus on and what to look for
Today’s post — How I comb through a 10‑K:
Business Description = “circle of competence” test — understand products, customers, industry, growth drivers, etc.
Risk Factors = red flags — looking for red flags here (changes from previous filings, concentration, debt/covenant issues, etc.)
Properties — occasional hidden asset value in owned real estate; good overview of lease exposure
MD&A = explanation of trends — management commentary, key events, changes in price/volume/mix, industry/macro background, occasionally good KPIs
Liquidity & Capital Resources — cash position + will operating cash cover upcoming capex, debt maturities, and buybacks?
Footnotes — revenue recognition, borrowings, lease obligations, and contingencies, etc.
Segment reporting — looking for most (and least) valuable aspects of the business
This post was inspired by a recent thread of my favorite 10-K sections… My goal here is to create a longer form guide on my 10-K process and hopefully something that can be referred back to for both gold standards and red flags. There are samples from 12-15 different K’s throughout this post.

Everyone has a different approach to this thing. Some investors read it from start-to-finish or skim chunks of it; and those approaches work fine. But I’ve found there are a few sections that are worthy of closer attention and weighting.
Oftentimes, I’ll find some highly valuable aspect of the business (like a crown jewel segment or unappreciated stickiness) and sometimes there are obvious reasons to stay away (imminent debt covenant breach).
Let’s dig in…
The table of contents for a typical 10-K looks something like this:

I’m not going to cover each section in-depth; instead, I’m focused on those few areas I think are worthy of more scrutiny. These are not ranked by importance:
Business description
Risk factors
Properties
Selected financial data*
Management’s Discussion & Analysis (MD&A)
Liquidity and capital resources
Financials and footnotes
Revenue recognition
Debt
Segment results
Contingencies
Subsequent events
*no longer required by the SEC and not included in filings newer than year 2020, but still worth your time
1) Business Description
A description of the business sounds basic, but you’ll see huge variations in quality by reporting companies.
Don’t fool yourself into believing you already have a good understanding of the business in question. I always read this section in its entirety.
A great 10-K will leave you with an excellent understanding of the products and services in the business plus the key drivers for those offerings. I look for company history, background information on what the business does, product details, key supplier details, distribution channels, competition details, business segments, industry charts, etc.
Here’s an example from BrightView (BV) with a very thorough description:
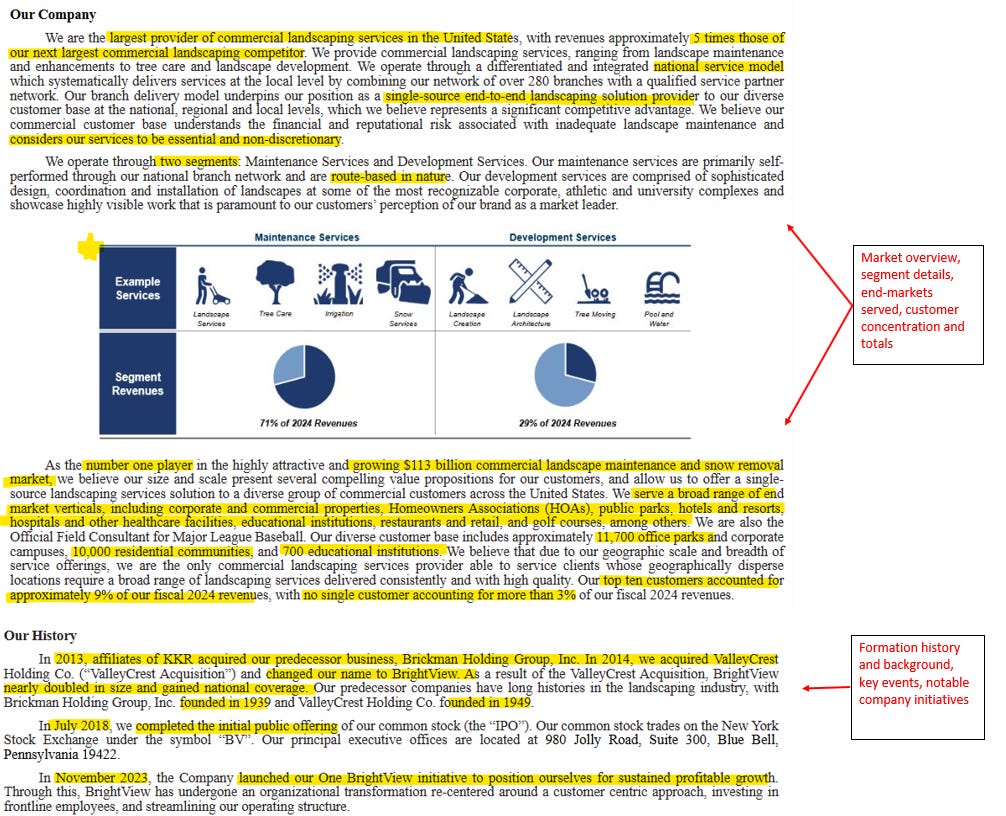
This description has tons of useful information — recurring revenue service model, their focus exclusively on the commercial side of the landscape industry, organizational model of their branch network, end-markets served, customer totals and concentration, industry dynamics and growth rates, etc.
Pool Corp (POOL) is another great example…
We operate in the outdoor living industry, which services approximately 11.0 million bodies of water in the United States alone, including 5.4 million in-ground swimming pools.
The description alone had tons of detail… sales are 20% remodel, 15% new build, and 65% maintenance. Management tracks consumer credit and housing turnover as industry KPIs. There were 72k and 61k new in-ground pools built during the past 2 years with a total installed base of 5.4m units. Pentair (PNR) is the largest supplier at 20%. Customer base totals 125k. And the list goes on…
My goal here is threefold:
Make sure I understand what the business does and how it operates (Buffett’s “circle of competence” concept)
Find the “crown jewel,” as-in, what are the most valuable segments or aspects of the business
What is management focused on — What new offerings or initiatives is management excited about? These will usually get more detailed coverage
Once finished, I should be able to explain how the business makes money from here (i.e. “they charge for subscriptions” or “they bill hourly” or “they have an installed base and sell consumables”). With really good business and industry descriptions, I’ll find myself referring back to certain 10-Ks when reviewing competing or adjacent businesses.
If I find a lackluster description, it doesn’t disqualify a company from becoming a good investment, but I’ll need to rely heavier on secondary research like investor presentations or earnings calls to fill in gaps.
2) Risk Factors
This section reveals major red flags including: customer or supplier concentration, debt or covenant issues, commodity risks, employee risks, or other exposures generally not found in the financials or footnotes.
Some samples:
Customer concentration — In 2012, Neustar Inc highlighted 60% of their revenue came from a group of contracts with a single customer that were set to expire in 2015. Neustar eventually lost this contract and shares fell by 40-50%.

Debt issues — One of the best indicators from this section are looming covenant issues with debt. Here’s Dolan Co straight up telling you they missed covenant calculations back in 2012. This company eventually filed for bankruptcy.

A good rule of thumb when skimming risk factors… if you see a lengthy explanation, numeric details (dollars or percentages), or lots of specificity, then it’s worth stopping to review what it says. This section is almost exclusively filled with red flags (i.e. negative attributes), but occasionally I’ll find a customer or supplier name revealed which allows me to track performance through that other company.
3) Properties
Typically, you can skim this section, but every once in a while you’ll find hidden assets in owned real estate not fairly valued on the balance sheet. Other times you'll find significant lease liabilities to watch out for (especially true for retailers and restaurants).
Here’s Scholastic (SCHL), a $460m market cap company as of this writing, with a 355,000 square foot office/retail property in Manhattan and 1.5m square feet of warehouse space. It’s possible these are worth a significant portion of the current market cap.

Another one is Tandy Leather (TLF), which owned its 191,000 square foot corporate headquarters and distribution center plus their flagship 22,000 square foot retail store. These were sold in a January 2025 sale-leaseback for $26.5m

When I find significant amounts of owned real estate in the properties section, I like to cross-reference the balance sheet or fixed assets footnote to see what carrying value might be. Or maybe I can find the year acquired (older is better from a “hidden asset” perspective). Alternatively, you could use a simple price per square foot formula to see what those properties might be worth. This is helpful for warehouse space or properties in prime locations (like NYC).
When dealing with leases, I want to see how leases are structured. Urban Outfitters (URBN) has initial lease terms of 5-15 years with renewal options of 5-10 years. Longer isn’t always bad, but if the company is struggling financially, then longer duration leases are a huge risk.

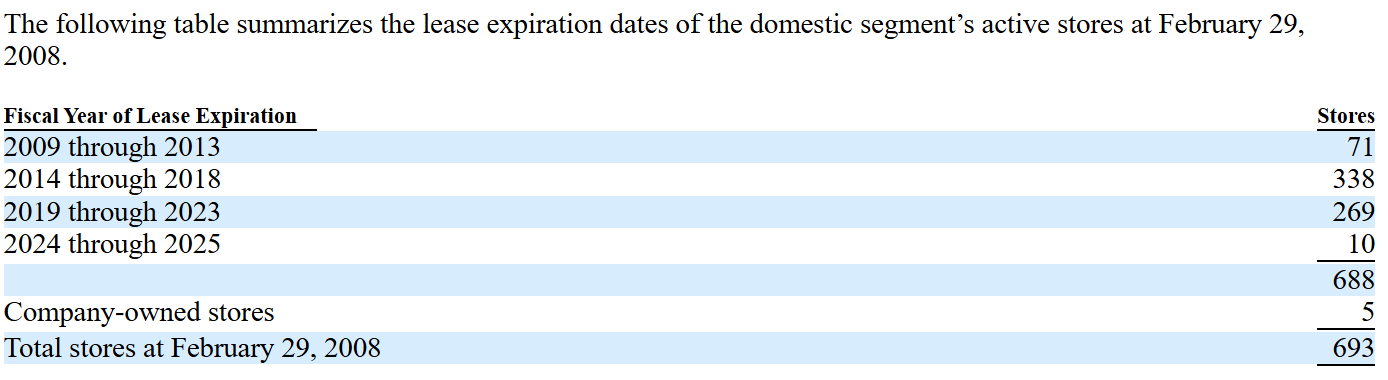
Occasionally, you’ll get a table spelling out when lease maturities by year. This is really helpful to assess lease risk… In 2008, Circuit City had ~700 leases with only 10% of them expiring over the next 5 years. They couldn’t get out of these leases quickly when losses were piling up and ultimately filed for bankruptcy.
4) Selected Financial Data
Item #6 in the 10-K includes a 5-year table of financial information (as opposed to the standard 2 years of balance sheets and 3 years of income statements).
This was my favorite section before the SEC killed the requirement in 2020. A clean 5-year view of the P&L, balance sheet, cash flow, and KPI data in a single table is immensely valuable for quickly getting up to speed on fundamental trends.
I’m looking for sales trends, earnings trends relative to sales, rapid growth in total assets or debt, consistent cash generation, and operational KPI trends I otherwise wouldn’t see.
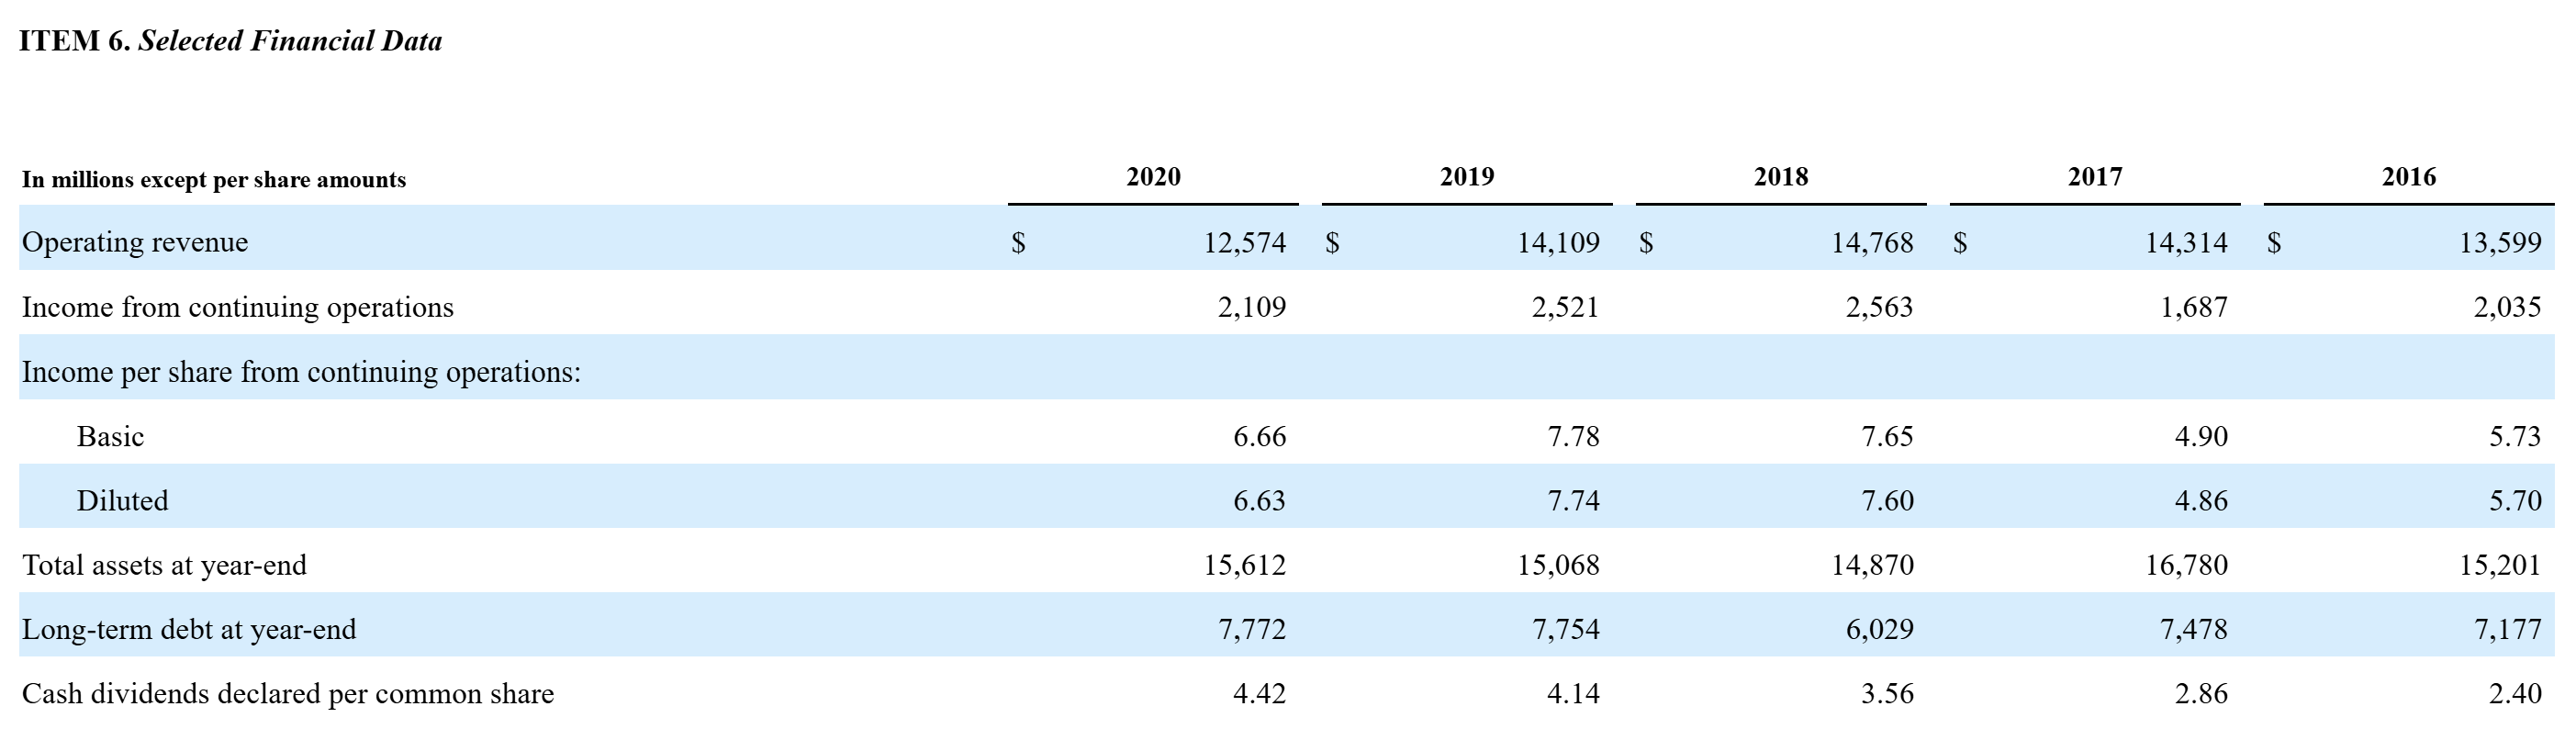
Much like other sections of the K, the quality here can vary widely. You’ll see some basic tables like this one…
…and more comprehensive tables like Fastenal (FAST) and AutoZone (AZO) which are rare exceptions still publishing multi-year financial data.
Fastenal gives us 10 years (!) of data with location counts and average monthly sales. It paints a totally different picture of the business with this decades-long view — Fastenal is closing full branch locations and opening onsite vending machine locations with no slowdown in overall sales growth.

More financial history is always better than less. I can easily spot lumpy results, big impairments, shifts in business, changes in capital allocation, or outlier trends. Industry-specific data can be great here too… retailers and restaurants include store counts, comp sales, etc.
Note: you’ll need to dig up an older 10-K if you want to get a look at it.
5) Management’s Discussion & Analysis (MD&A)
The MD&A is where management can tell investors why financial performance is changing. Why are sales, expenses, and earnings up or down from the prior period?
If you want to understand recent business trends and develop an outlook, then you’ll want to spend plenty of time looking over the MD&A.
Some items I look for:
Impact of price, volume, mix, or M&A on revenue — namely, is revenue growing solely from price increases while volume is declining year-after-year? Is revenue growth coming entirely from M&A?
Key metrics management is focused on (they’ll typically spend more time discussing these)… ideally, I want to see both financial and non-financial KPIs
Industry or macro events impacting the business (example: input cost price swings)
Non-GAAP calculations (you’ll often find reconciliations from GAAP to non-GAAP metrics here)
Segment performance — which segments are struggling and which are performing well
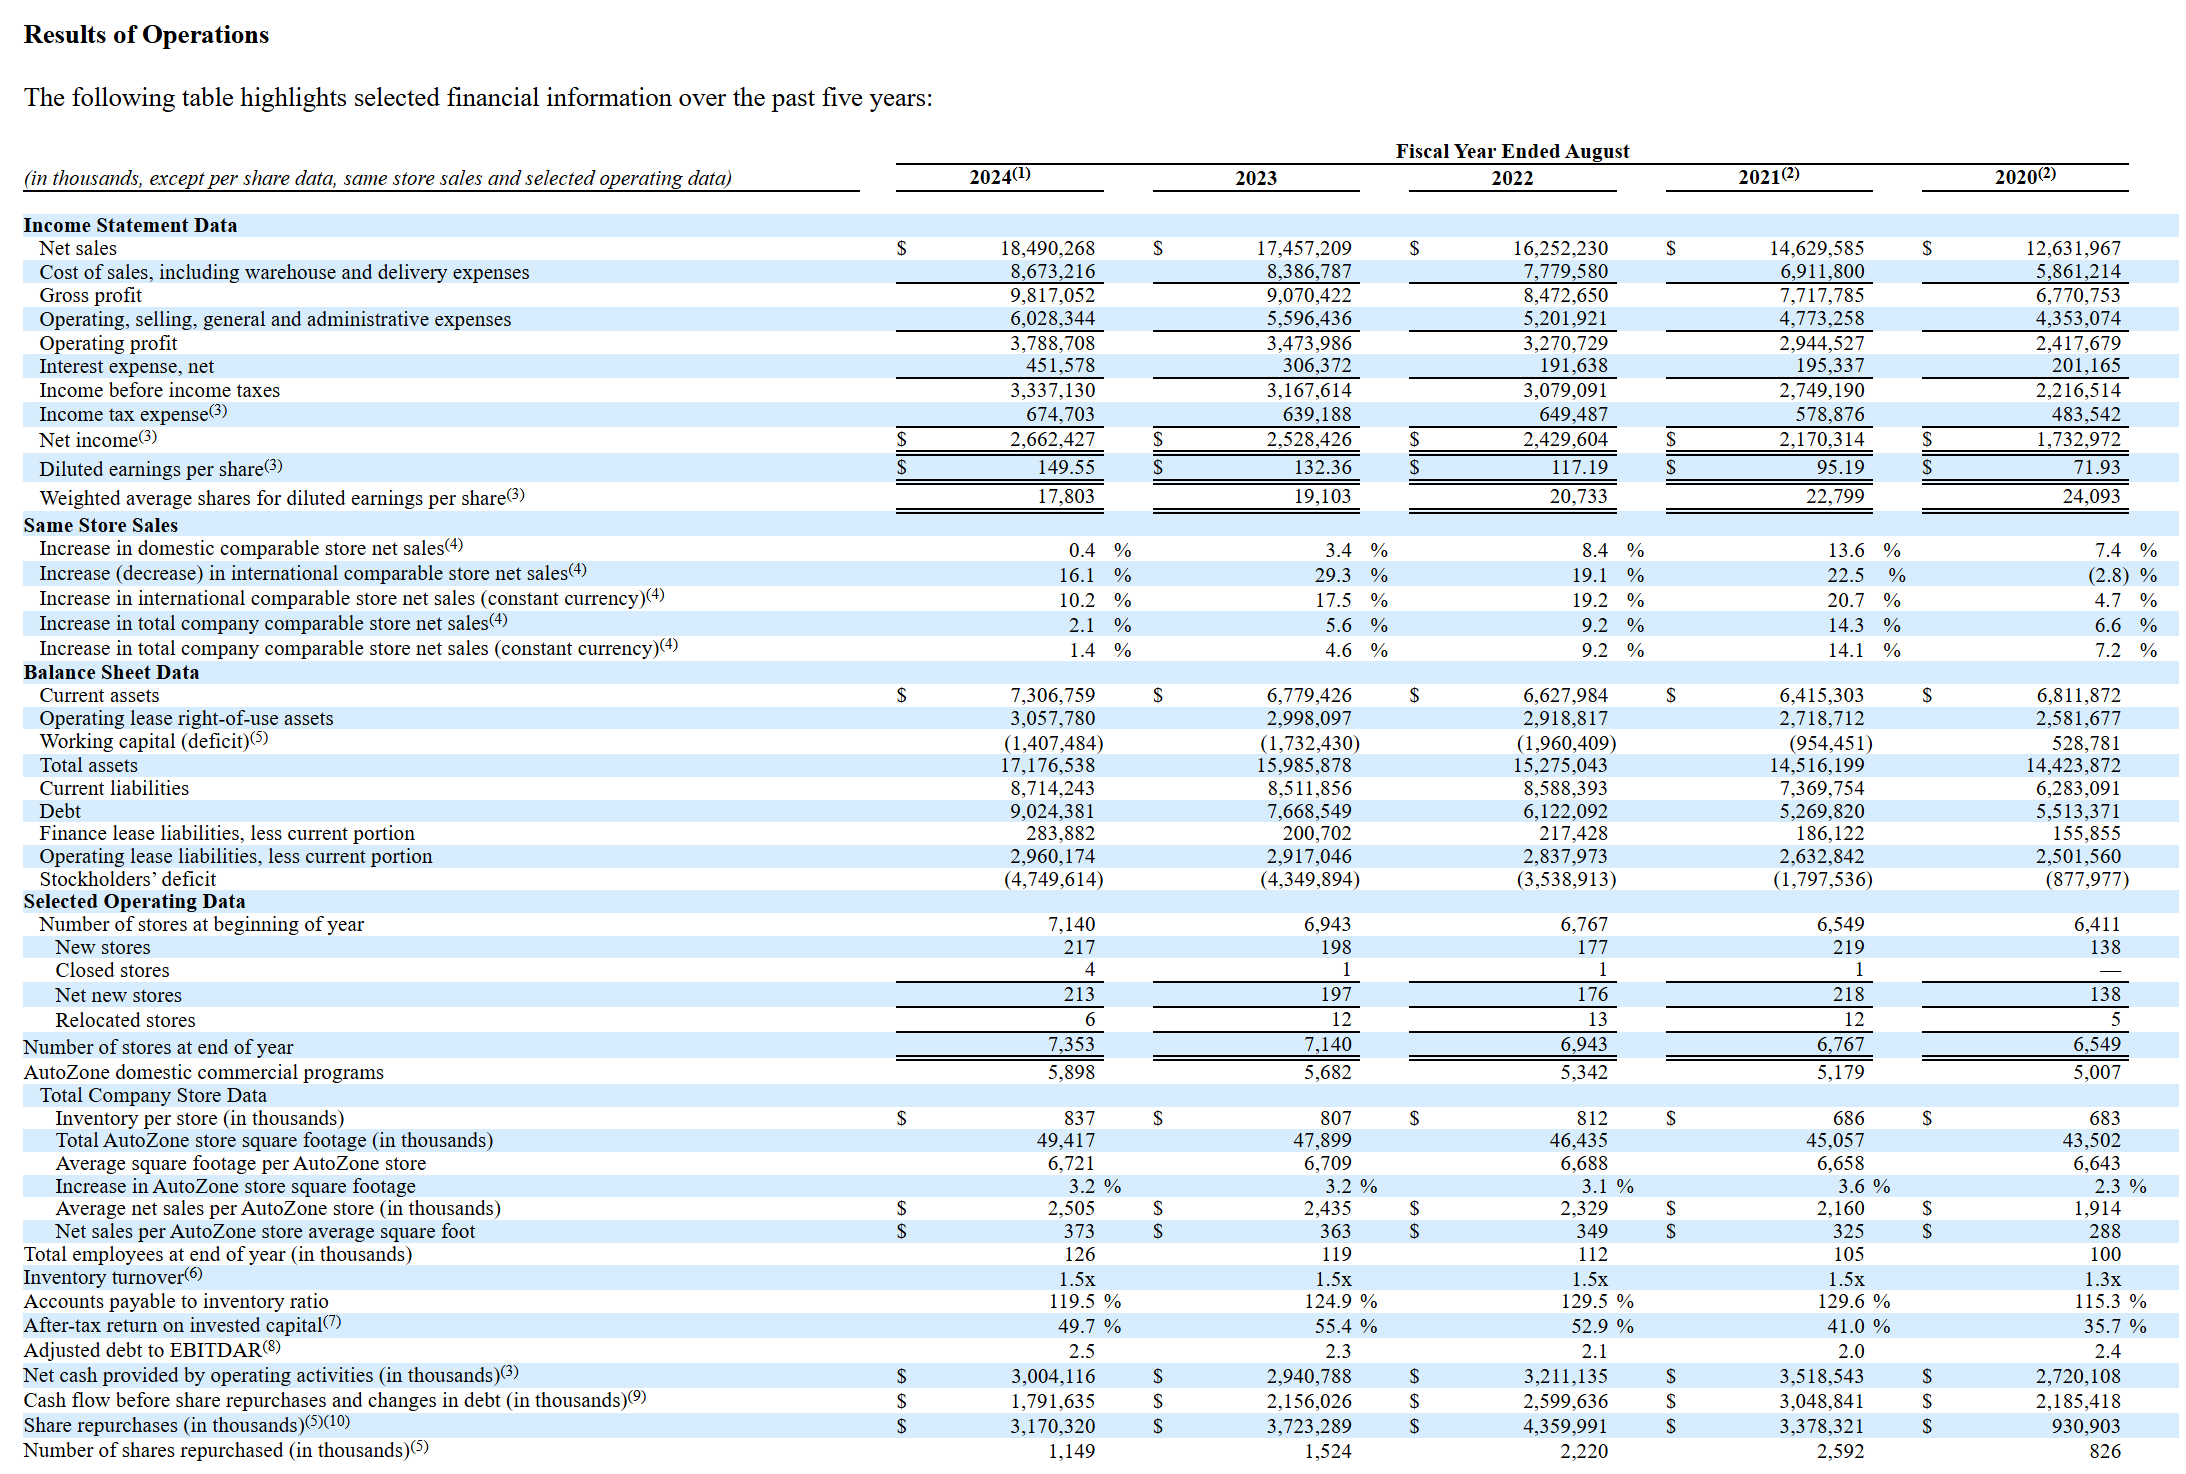
AutoZone (AZO) has one of the most comprehensive MD&A sections I’ve seen. They give a quick description of the business (in easy-to-understand language), highlight overall trends and recent activity in the business, share leading indicators driving performance, and give an incredibly detailed table of 5-year financial performance.
Where AutoZone stands out is discussing key metrics — store composition, square footage changes, inventory and sales per store, inventory turnover, ROIC, leverage profile with leases, and share repurchase activity — this one page gives you a complete read on financial health and trends.
The general question I’m looking to answer here?
What are the current trends of the business… if trends are bad (negative), are they easing or starting to turn a corner? The cause of those trends are also important; competition stealing demand / market share would be worse than temporary headwinds on raw material price swings.
6) Liquidity & Capital Resources
You can find this brief section tucked at the back of the MD&A. In it, management describes their current cash position, changes in cash flow, and a cash assessment for the upcoming year (i.e. will they have enough internally generated funds to cover operations). It’s rare, but you want to watch out for known cash flow problems.
Think of it as MD&A strictly for cash and cash flow. Here’s how AutoZone (AZO) described the changes in investing cash flows during 2024:
The increase in net cash used in investing activities in fiscal 2024 was primarily due to an increase in capital expenditures. We invested $1.1 billion, $796.7 million and $672.4 million in capital assets in fiscal 2024, 2023 and 2022, respectively. The increase in capital expenditures from fiscal 2023 to fiscal 2024 was primarily driven by our growth initiatives, including investments in new distribution centers and stores to be opened in subsequent periods as well as stores opened in the current year. We had net new store openings of 213, 197 and 176 for fiscal 2024, 2023 and 2022, respectively.
And here’s an excerpt from Brunswick (BC) on their 2025 outlook for cash / capital allocation:
2025 Capital Strategy
We anticipate executing a thoughtful capital strategy in 2025 with planned debt reductions of $125 million, capital expenditures at levels similar to 2024 of $160 million, and a minimum of $80 million of share repurchases, which could increase in the event cash generation outpaces initial expectations.
I find this helpful when trying to understand how management thinks about cash and the future use of cash flow.
7) Financials and footnotes
Analyzing the financial statements and footnotes is where you’ll spend the bulk of your time in the 10-K and that process goes way deeper than the subject of this post.
What to look for depends on the business, industry, and financial situation of the company. My generic checklist would include:
Revenue and earnings direction (growing, stable, or declining)
GAAP earnings and a quick assessment of adjusted earnings (net income plus impairment charges plus amortization) — I’m looking for high conversion of EBITDA into FCF; in those situations, I’m much more willing to rely on EBITDA as a valuation multiple
Artificial financial constraints — examples would be a large dividend relative to FCF, operating income covering interest and other expenses, large debt balance relative to FCF, large A/R balance relative to revenue
Balance sheet has a litany of ratios to cover — current assets vs. current liabilities, asset growth relative to revenue growth, debt and equity balances, working capital relative to total sales
Leverage — gross debt balances relative to operating cash flow and free cash flow (not EBITDA)
Cash flow and quality of cash flow (i.e. mainly driven by net income and D&A or is working capital providing most cash inflows)
Sources and uses of cash flow (yearly and cumulative inflows vs. outflows by bucket) — capital allocation assessment
Financial statement analysis isn’t some rote exercise where a simple checklist defines what to look for. Do I always need revenue growth? No. Do earnings need to be positive? No. Whatever theme an investment falls into will dictate the attributes I’m seeking (example: in a turnaround, I’d want to see working capital inflows creating cash, SG&A falling faster than sales, and gross margins improving)
The footnotes vary by company, but generally look something like this:

Leases are important for retailers and restaurants, property and equipment is important for capital-intensive businesses like equipment rental, investments are important for insurers and financials, stock-based compensation is important for technology companies.
8) Revenue recognition
Why should this section matter to you?
There are 2 benefits here:
Better understand how revenue works — Are there management estimates involved? Is there recurring revenue? How many revenue streams are in the business? How lumpy is revenue? Clarify any nuances not outlined in the business description section.
Circle of competence — Revenue recognition is especially helpful for complex business models or if you’re lukewarm on understanding how the company makes money.
Kelly Services (KELYA) provides temporary staffing services and has a great rev rec section… most of their offerings are billed monthly and use a plain “hourly rate” model, but other offerings have retainers or “outcome based” billing methods.

PRA Group (PRAA) is a consumer debt collector buying and collecting on unpaid loans. Revenue is highly subjective.
Revenue recognition - finance receivables
Revenue recognition for finance receivables involves the use of estimates and the exercise of judgment on the part of management. These estimates include projections of the amount and timing of cash collections we expect to receive from our pools of accounts. We review individual pools for trends, actual performance versus projections and curve shape (a graphical depiction of the amount and timing of cash collections). We then project ERC and apply a discounted cash flow methodology to our ERC. Adjustments to ERC may include adjustments reflecting recent collection trends, our view of current and future economic conditions, changes in collection assumptions or other timing related adjustments.
Significant changes in our cash flow estimates could result in increased or decreased revenue as we immediately recognize the discounted value of such changes using the constant effective interest rate of the pool. Generally, adjustments to cash forecasts result in an adjustment to revenue at an amount less than the impact of the performance in the period due to the effects of discounting. Additionally, cash collection forecast increases result in more revenue being recognized, and cash collection forecast decreases in less revenue being recognized, over the life of the pool.
I get a better sense for how a business makes money after reading their revenue recognition practices. If I don’t fully understand the business, and their revenue practices don’t make sense, then I’ll probably steer clear.
9) Debt (Borrowings)
Why look at the debt footnote when you can find the balance on the face of the balance sheet?
The debt footnote has tons of valuable context like the original date and terms of a loan, any modifications or amendments made over time, interest rate calculations, covenant descriptions, structure of principal payments (i.e. amortizing vs. balloon), limitations on dividends or buybacks, convertible terms, etc.
Also, I’m guilty of pulling debt balances from the face of the financials, but GAAP requires those amounts to be reported net of debt issuance costs which can add up.
For companies with large amounts of debt, I’ll use the maturity table to: 1) see if there are large upcoming maturities which could pressure cash flow; and 2) get a sense for whether future interest expense is heading higher or lower.
For example, Berry Global (BERY) has upcoming debt maturities in 2025-2027 with very low rates (below 2%), but recent debt issuances are 5-6%, which means debt is rolling over at a much higher clip. For every $1 of debt, they’ll have to repay 67c just to keep interest expense flat!

10) Segment results
My favorite section and usually where I go first.
Most businesses have multiple reporting segments. Typically, results are reported by: 1) geographic location (i.e. U.S., Europe, Asia, domestic/international, etc.); 2) business division (industrial, automotive, healthcare, etc.); 3) by sales channel; or 4) by product line.

I find geographic segmentation to be least useful since most companies will generally tell you their domestic vs. foreign revenue mix elsewhere in the 10-K. Smaller companies with foreign segments can have different margin profiles if sub-scale which is helpful.
Segmentation by division, channel, or product line are immensely valuable and I find myself jumping to this section early in my research process because the “crown jewel” of the business usually reveals itself quickly.
Some examples…
Motorcar Parts of America (MPAA) had 2 reportable segments in 2012, one was growing and profitable while the other was losing money and highly levered.

It was clear where the crown jewel of the business was. So when management shuttered the division in mid-2013, shares jumped from ~$10 to ~$30.
Things get really interesting when you find a company with very disparate business units (like RCM Technologies with health care staffing, IT management, and industrial engineering). Here is Gibraltar Industries (ROCK) with 4 very different business lines and diverging performance from 2022-2024 despite overall earnings growth.

The market often overlooks a high quality segment tucked inside a completely disparate business. Also, be on the lookout for frequently changing segment reporting. If management continually reshuffles how they share information, then there’s a good chance they’re trying to hide underperformance somewhere.
11) Contingencies
This is probably most relevant for serial acquirers using contingent consideration to make acquisitions. Contingent liabilities include lawsuits, warranties, or acquisition financing based on future business performance. These only get reported on the balance sheet when they are both: 1) more likely than not to occur; and 2) estimable.
Here’s a product liability claim from Wabash National (WNC) which was an ~$800m market cap at the time this $460m liability (!) was recorded in “Other non-current liabilities” on their balance sheet:

Occasionally you’ll find a contingent asset (which cannot be recorded on the balance sheet until it’s completely known and locked in). A contingent asset could be a potential insurance or lawsuit recovery.
12) Subsequent events
This section is a quick skim. Only occasionally will you find something notable here.
In those few situations, it could be a big deal! Management needs to disclose material events between the filing date of a 10-K (call it December 31st for most businesses) and the date the K is filed (usually within 90 days of the filing date).
Maybe the company wrapped up a meaningful share buyback or tender offer, maybe they accepted or closed a big acquisition, maybe a contract was lost of went up for bid, it could be anything.
This section is particularly important for distressed businesses or turnaround situations. Here’s Babcock & Wilcox (BW) with a flurry of events as they fight for survival:

Summing it up…
There’s no one-size-fits-all approach here; but no matter how you do it, you’re better off reviewing the “K” before investing in a business.
My overarching goal is to find the most valuable aspect of the business at hand (what makes it an attractive investment) or to find the reason(s) not to invest (red flags). These findings need to be combined with other parts of the research process like reviewing earnings calls, investor presentations, secondary research, reviewing competitors, etc.
Drop a comment with a 10-K you found particularly helpful!
Resources — a list of 10-Ks reviewed in this post plus some other stuff: