Quick Value 10.11.21 ($CNQ)
Canadian Natural Resources - oil sands major at 9x FCF
Market Performance
Market Stats
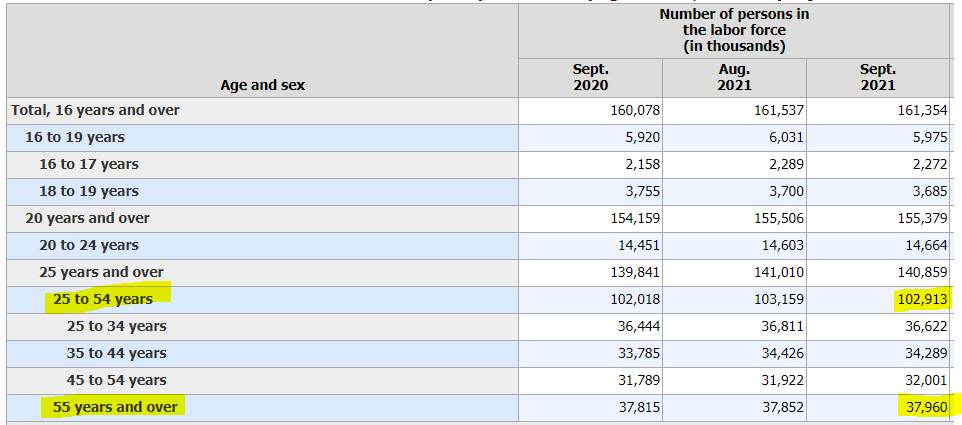
Labor force participation rates are changing… Overall participation rates have been declining the last 10 years… The Age 25-54 bucket has recovered back to 10-year average level (81.6%) but the 55+ bucket is much lower (38.6%)
The labor force is made up of ~161m people with 2/3 in the 25-54 age bucket and nearly 1/4 in the 55+ age bucket…
From December 2019 to September 2021 approximately 5.1m are no longer employed… of that 5.1m, 2.6m are women and 2.5m are men… of the 5.1m — $3.3m are ages 25-54 and 1.1m are 55+
Quick Value
Canadian Natural Resources ($CNQ)
Perhaps I’m a bit late to this one with shares up 65% YTD and 120% over the last year. Still, the stock has underperformed the S&P 500 over the past 3, 5, and 10 year periods.
CNQ is an oil and gas exploration and production company based in Canada. Their asset base is a mix of traditional crude oil sources, oil sands, and some natural gas. The big selling point is the huge reserves and low decline rates of their production. They have ~12bn barrels of oil equivalent sitting in the ground ready to go and produced about 400m barrels in 2020 — roughly 30 years of production available (much higher than competitors).
This is a business that has been a consistent generator of cash flow (unlike many others in the energy industry). While 2020 took a big bite out of cash generation, 2021-2022 look like banner years for cash flow…
From 2018-1H2021, CNQ generated $29bn in operating cash flow… Of that, they spent $12.2bn on capex for total free cash flow of $16.8bn. (Figures in Canadian dollars.) Looking at how they allocated that FCF:
$6.3bn spent on dividends — current yield is around 3.6%
$2.7bn spent on share repurchases
$4bn used to repay debts
$3.4bn used on an acquisition
Overall a pretty balanced picture with >50% going to shareholder returns. With oil prices nearing multi-year highs of ~$80/barrel, it seems likely that 2022+ should reap better cash flows than even management predicted in their chart above.
CNQ has 1.18bn shares outstanding and a $50 share price (in CAD) = $59bn market cap + $18bn net debt makes it a $77bn enterprise value in Canadian dollars.
On the latest earnings call, management signaled $7bn+ (CAD) in free cash flow at average annual oil prices of $66/barrel. That puts the stock at 8-9x FCF. They indicated a share repurchase plan totaling 1% of shares per quarter and at least 50% of FCF going toward share repurchases…


