Quick Value 12.30.19
Goldman Sachs ($GS)
Market Performance
[Index | Last week ==> This week | % change]
S&P 500 | 3221 ==> 3240 | +0.6%
Dow Jones | 28455 ==> 28645 | +0.7%
Russell 2000 | 1672 ==> 1669 | -0.2%
Russell Microcap | 619 ==> 621 | +0.3%
10-Year | 1.92% ==> 1.88% | -4bps
Gold | 1482 ==> 1516 | +2.3%
Oil | 60 ==> 62 | +3.3%
VIX | 13 ==> 13 | unch
Market Stats
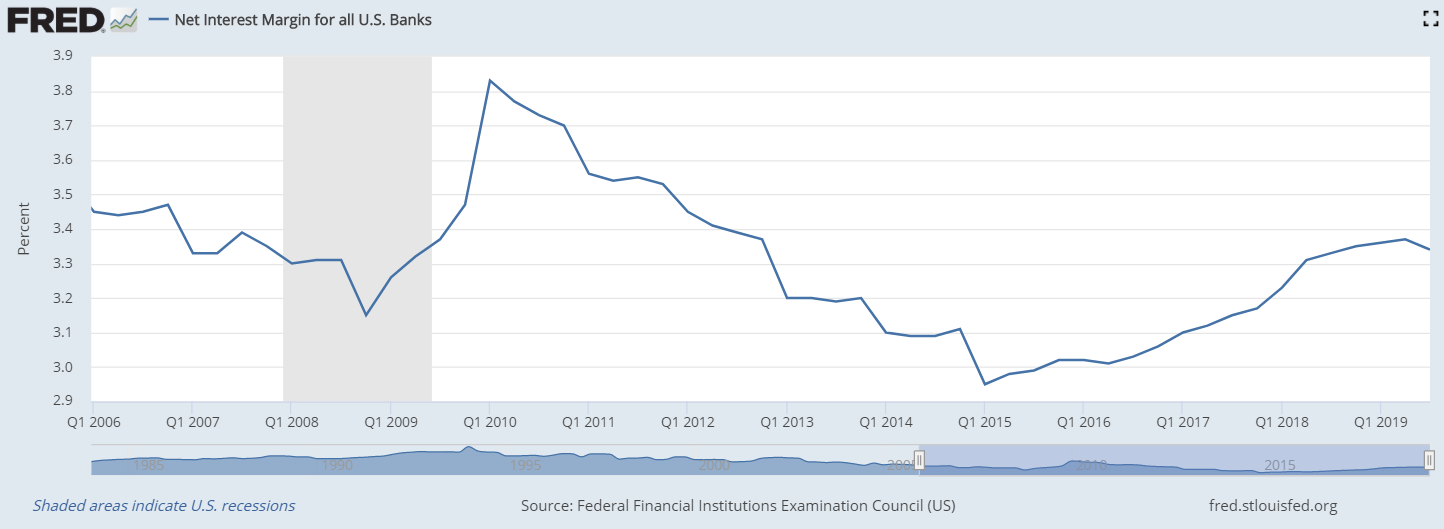
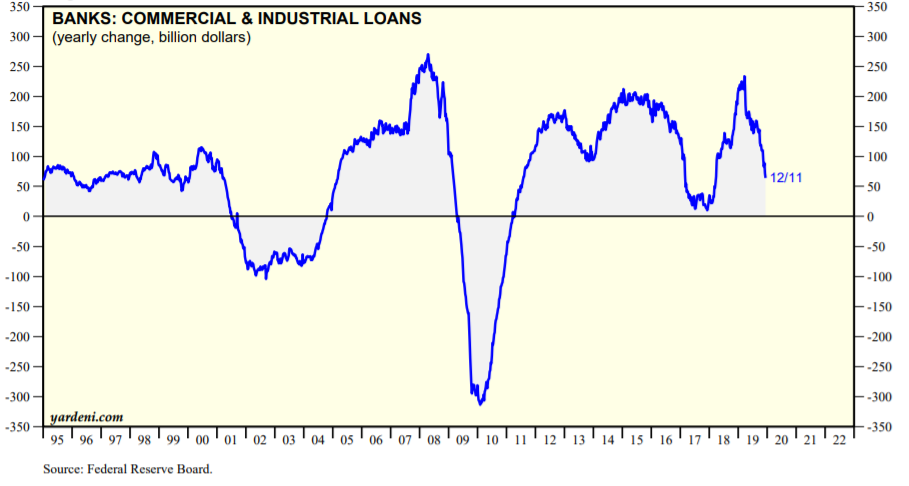
Bank lending is a key engine to economic growth. The series of charts below highlight Net Interest Margins, Loan Growth, and Equity to Assets at US banks.
Key highlights:
Margins still at profitable levels for banks (+)
Loan growth has been slowing (-)
Equity to assets has been improving since the ‘09 crisis (+)
The Fed has started to lower rates again (-)
All-in, this is somewhat of a mixed bag for future prospects. But at a quick glance, signs point to a healthy environment for bank lending and profits.


Quick Value
Goldman Sachs ($GS)
This is a $230 stock with $226 per share in book value (assets minus liabilities) or roughly 1x price to book (P/B). 1x P/B has been a good benchmark for $GS post-crisis so this is about an average valuation for this business.
Two quick comments on this:
Stock has gone nowhere for years (flat since Nov 2016)
Book value per share has increased from $171 to $226 since 2015 (7% per annum)
Flat stock price with improving fundamentals is not a bad place to be. Estimates call for $24 per share in earnings in 2020 making this a 9.5x PE stock (assuming estimates are accurate).
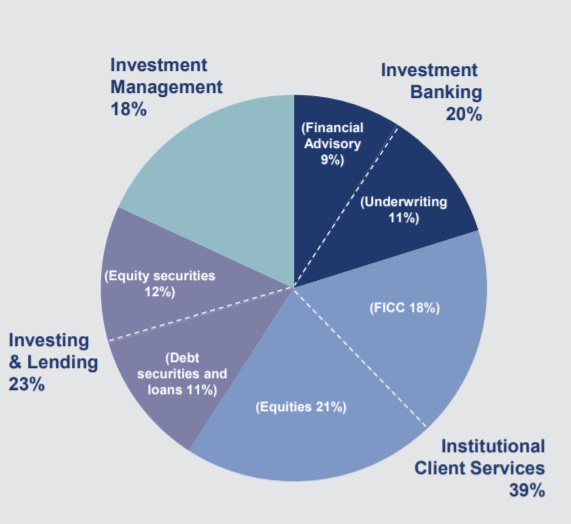
This is a pretty diverse financial institution:

Also, these guys have been aggressive buyers of their own stock for years now taking the share count from 435m in 2015 to 350m today. A modest dividend (2% yield) to boot.
Overall, not a bad setup for a quality financial institution albeit with some sensitive aspects to the business (investment banking, trading, etc.).
