Quick Value 2.28.22 ($BRK)
Check out the new VDL website www.valuedatalibrary.com. You can find the Quick Value archives or sign up for the premium plan (which is totally worth it!). [If you’re feeling adventurous you can check out my video walkthrough.]
Market Performance
It was a surprising finish to the week with most indices finishing up week-over-week.
Market Stats
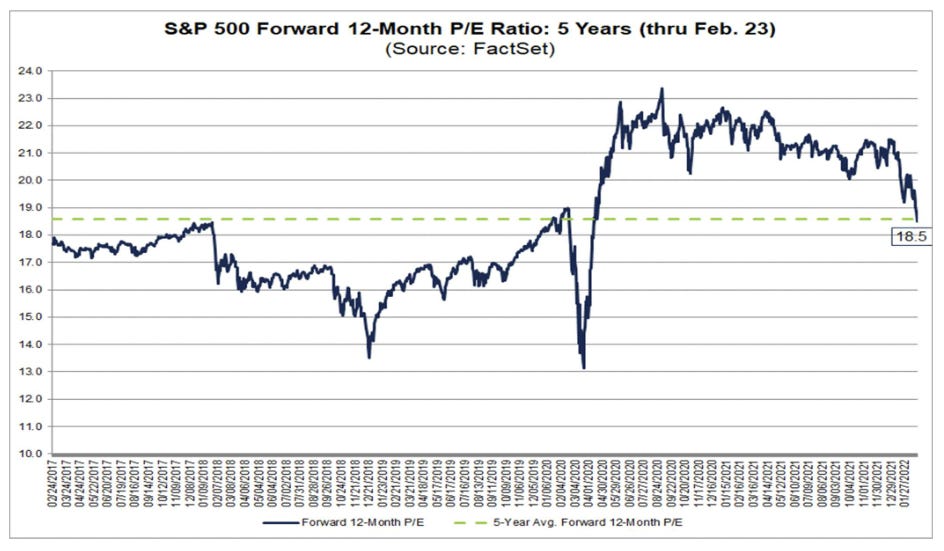
S&P 500 trading at ~18x forward earnings according to FactSet… down from 22x+ over the past year.
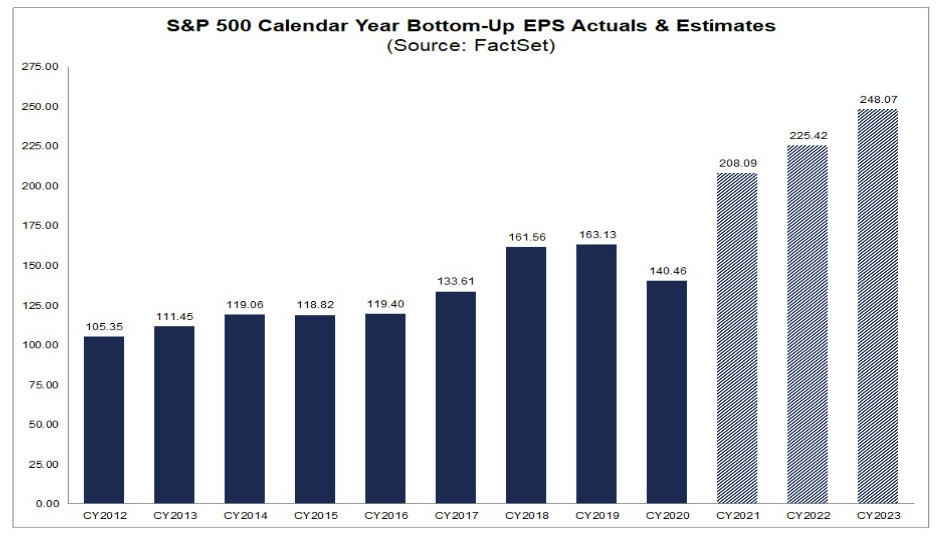
Earnings estimates anticipate 8.2% growth from 2021-2022 which would also imply 11.3% CAGR from 2019. Yardeni has a nearly identical view of S&P 500 operating earnings.
Quick Value
Berkshire Hathaway ($BRK)
I’ve seen plenty of analysis on the shareholder letter and 2021 results so I’ll try to keep my thoughts different from the widely covered buyback news….
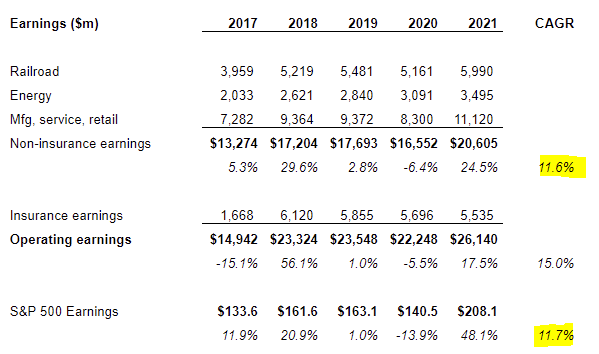
For starters, here’s a quick snip of 2019-2021 earnings by segment:
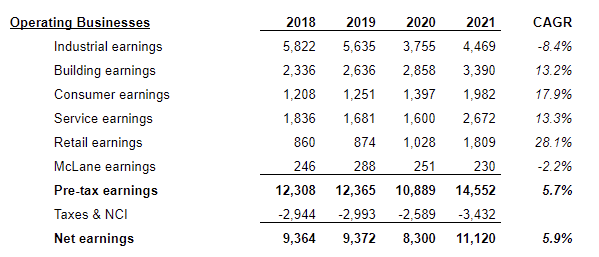
And here’s a quick look at the past 5 year of net earnings performance…
Excluding investment activity, operating earnings were ~$26bn in 2021 vs. $22.2bn in 2020 and $23.5bn in 2019. From 2017-2021 the non-insurance businesses grew earnings at an 11.6% CAGR vs. the S&P 500 growing earnings at a slightly better 11.7% per year.
You could make the argument that Berkshire’s collection of operating businesses will perform more-or-less inline with the S&P 500 over time. Maybe with less volatility or downside risk.
It’s kind of an odd structure but the Berkshire Hathaway real estate brokerage business is nestled inside Berkshire Hathaway Energy (BHE). The real estate business has grown 16% annually since 2017.
A closer look at the sub-segment performance of operating earnings reveals varying degrees of growth. Some sub-segments have really kicked into high gear post-COVD.
From the chart above, industrial earnings has a big contribution from Precision Castparts Corp which kicked in $1.2bn earnings up 78% from 2020. Lubrizol earnings were down 50% in 2021 (~$500m) and Marmon was up 40% (~$1.4bn).
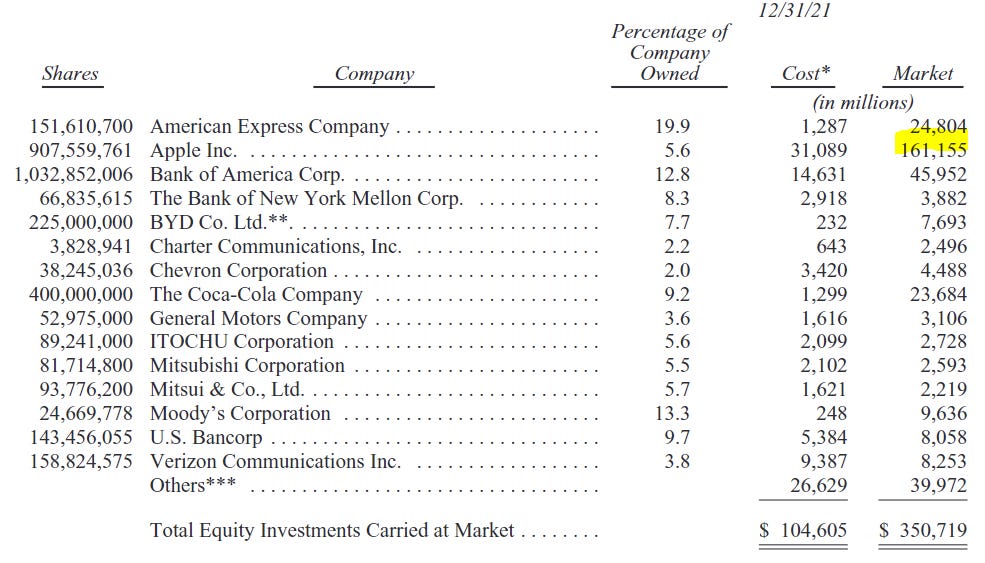
A look at the $350bn investment portfolio… $161bn of which consists of Apple shares.
A quick recap of the 2-column valuation method — using a 13x multiple on operating earnings nets a $352 share price
Cash & investments around $530bn or $234 per B share
Non-insurance net earnings were $20.6bn in 2021; capitalized at 13x would be $268bn or $118 per B share
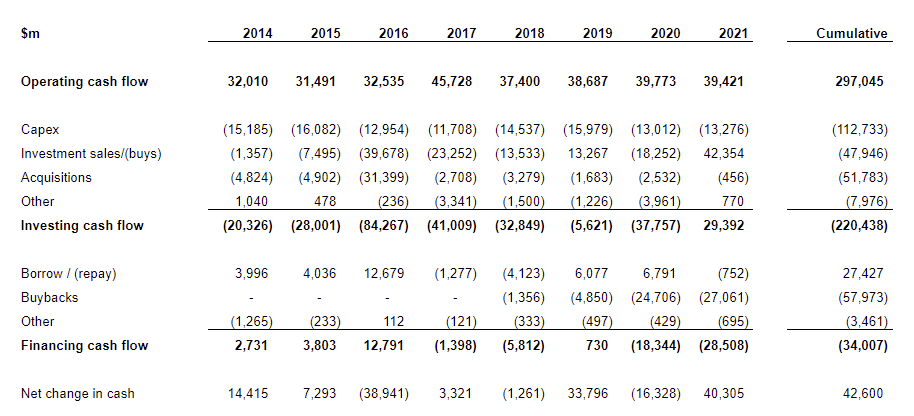
Free cash flow was ~$26bn in 2021 — it looks like Berkshire hasn’t made any improvement in cash flow for several years now
The buybacks (totaling $27bn in 2021 and $24.7bn in 2020) look great on the surface but Berkshire isn’t anywhere close to spending down the mega-cash-pile… these buyback amounts represent just the annual FCF generation of the business.


