
Quick Value #259 - Berkshire Hathaway (BRK)
Stock isn't cheap, but sits on an ever-increasing pile of cash; can they (ever) fully deploy this balance sheet??
Today’s idea:
Operating earnings +24% in 2024 ($44.5bn)
Cash & investments total $652bn ($302 per share)
Shares trading at ~27x EV to operating earnings (non-insurance)
Book value +16% in 2024 ($649bn / $300 per share) and trading at 1.7x P/B
Keeping with tradition covering Berkshire annual results. Past posts: 2023, 2022, 2021, 2020, 2019. Trying to keep this 90% analysis of the fundamentals, but I can’t see how they’ll ever get this cash balance fully deployed. Read on…
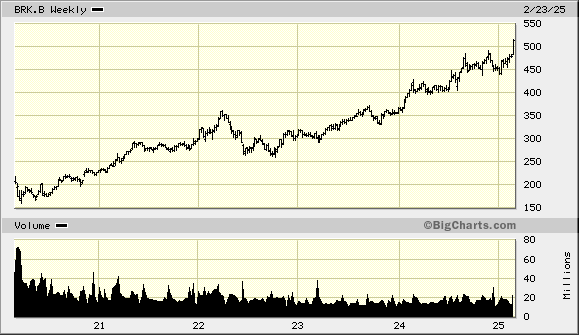
The stock has been on a massive run the past 5 years with much of that coming in the last year alone. I’m trying to understand how justified that move is. Buffett’s letter didn’t have any noteworthy takeaways so I’m focused on solely the financial results here…
For starters, BRK.B is trading at $514 with 2.157bn shares outstanding = $1.11tn market cap.

1) Overall operating performance
There are 189 subsidiaries in this mini index fund, but I find it helpful to bucket them into 4 groups — insurance, railroad, energy, and “everything else” (manufacturing, service, retail, etc.). Here are net earnings for those buckets over the past few years:

Quick take: the combined portfolio of operating businesses (non-insurance) underperformed the S&P 500 for quite some time. Granted, BRK has zero exposure to technology in their OpCo portfolio and that sector makes up >30% of the S&P 500 weighting. I’ll unpack this a bit more later on.
The path of least resistance would be extrapolating 2024 results with the insurance segment included and call the stock cheap at ~13x EV to combined operating earnings.
2) Insurance performance
The insurance business has been a huge contributor to earnings since 2022. And it’s coming from growth in both investment income and underwriting income. Underwriting income was <$1bn each year from 2019-2022, jumped to $5.4bn in 2023 and $9bn in 2024. This 2024 earnings result is multiples better than any historic underwriting performance by BRK. Hmm…

Rates are higher and Berkshire has a huge treasury portfolio so naturally investment income is up. Averaged ~$5bn per year during 2019-2020, jumped to $9.5bn in 2023 and $13.7bn in 2024.
Reinsurance had a very difficult operating environment for years and is finally producing “normal” earnings. That said, I probably wouldn’t extrapolate 2024 insurance results into the future.
3) Non-insurance operating performance
Starting with railroad and energy segments…

Railroad earnings are down from 2018-2024, probably a fine source of capital for other investments but hard to imagine this isn’t a disappointing stretch of performance. Berkshire paid $44bn to acquire BNSF back in 2010 (including debt assumed).
BHE consists of the regulated utilities and natural gas pipelines (plus real estate brokerage which is basically a breakeven business). Pre-tax earnings haven’t budged for several years but this segment is benefitting from increased tax credits on renewables (hence the “negative” tax expense).
Next is the manufacturing, service, and retail category where we get a glimpse of 7 sub-segments. This basket of companies grew earnings at a 5.7% clip from 2018-2024.
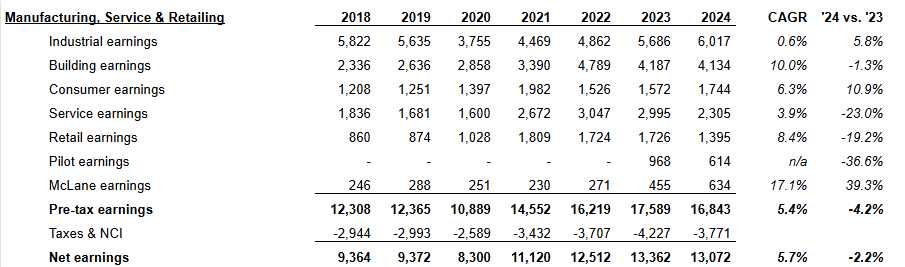
Most of these have been so-so performers since 2018; except for building products which grew earnings at a 10% CAGR from 2018-2024. Many of these segments experienced a COVID demand spike which continues to wane (consumer, retail, service).
4) Cash and investments
Berkshire ended 2024 with
$47bn cash
$286.5bn short-term treasuries
$271bn equity securities — usual actors: AMEX, AAPL, KO, BAC, CVX
$31bn equity method investments — KHC, OXY
$125bn long-term debt balance — most of this sits at the non-insurance portfolio
Cash and equivalents total $334bn or $155 per share. Tally up all cash and investments (including bonds) and you have $652bn or $302 per share.
Buffett sold a big chunk of Apple stock in 2024 which left Berkshire with nearly 2x their 2023 cash position. Sure, they’re finally earning a return on this cash, but a huge portion of this balance should be considered “excess” cash.

The last reference to a “minimum” cash balance was in the 2014 letter where Buffett referenced holding at least $20bn on hand. Float is ~2x higher today than it was back then, so maybe $40-50bn is a reasonable minimum cash balance? Call it $280bn of excess cash on hand right now.
5) Cash flow and capital allocation
Here’s a look at sources and uses of cash over the past 8 years:

Cash flow was maybe artificially low in 2024 from a big tax bill (>$26bn) on the sale Apple stock. FCF was $11.6bn in 2024 and a cumulative $196bn from 2017-2024.
There wasn’t much (any?) commentary on how they plan to deploy cash other than a desire to purchase more businesses. But they’ve only spent a total of $30bn on M&A since 2017. Without any major acquisitions on the horizon, it doesn’t seem like a realistic capital allocation outlet.
Buybacks are slowing too. From ~$25bn in each of 2020-2021 down to $3bn in 2024. My guess is the share price appreciation has been a deterrent.
So where will all this excess cash go? And when?
6) Valuation
Sticking with Buffett’s 2-column valuation method (outlined in the 2010 shareholder letter), we separately value the operating businesses excluding insurance operations and the investment portfolio.
Cash and investments are roughly $652bn or $302 per share.
Non-insurance operating businesses had net earnings of $21.8bn in 2024 (vs. $20.8bn in 2023 and $22.4bn in 2022)
By using the current balance of cash and investments, we’re implicitly taking that figure at face value (i.e. assuming equity securities are fairly priced, no tax leakage, etc.).
Buffett argues there’s technically a “third” column to this valuation approach in future capital allocation. Hard to argue there’s much in this column with nearly all capital piling up as cash for years.
With shares at $514, you’re essentially getting the operating businesses at 21x net earnings. Hardly a bargain, but maybe not overpriced in comparison to the batch of “high performance conglomerates” (DOV, FTV, AME, ROP, ITW, etc.) which trade at 24x earnings / 17x EBITDA.
Summing it up…
Berkshire is basically an index fund with very little tech exposure and a huge net cash balance sheet. For the average “know-nothing” investor, it’d make a great pairing with an S&P 500 index fund, especially if you’re concerned with the current weighting and valuation of tech stocks in the S&P 500.
With such a cash rich balance sheet, you’ve got some downside protection and a management team with a penchant for deploying cash in a downturn.
My big hang-up (other than valuation) is that I can’t envision a scenario where they put this cash to work outside of buying back stock above intrinsic value OR turning on a dividend. It seems that owning Berkshire will net you a 5-7% earnings grower (non-insurance) and an ever-increasing pile of cash and investments. Nice downside protection perhaps, but it comes with a 20-25x earnings price tag. Hmm…
Disclosure: no position.