Quick Value 3.30.20
Best Buy ($BBY)
Market Performance
[Index | % change WoW ]
S&P 500 | 2541 +10%
Dow Jones | 21637 +13%
Russell 2000 | 1132 +12%
Russell Microcap | 410 +10%
10-Year | 0.68% -19bps
Gold | 1625 +9%
Oil | 22 +10%
VIX | 66 unch
What a wild week it was!
Keep in mind the S&P 500 is still down about 14% from 3.2.20 and smaller names are down even more (-23% for the Russell 2000). Volatility (as measured by the VIX Index) held steady at 66 for the week.
Market Stats
How bad could things get?
As for economic forecasts, you’ve got:
With a $21.5tn economy, that would mean a $1.4-2.7tn hit in Q2 alone. Understanding the short-term ramifications of a shutdown may not be nearly as difficult as understanding the medium to long-term impact of lost jobs, lost businesses, and changing consumer behavior.
Initial jobless claims just topped 3m last week (literally off the chart):

On top of this, you have a Federal Reserve which just topped $5tn in assets on its balance sheet after an unprecedented level of QE… An amount that is likely to grow significantly from here…

So in one corner you have: unemployment, business closure, an lower sales from shutdown… and in the other corner you have: low interest rates, low oil prices, huge amounts of Government debt… Good luck predicting this outcome with any level of confidence…
If you are interested in trying to predict, then I’d start with GDP and the various subsectors of the economy:

Areas such as housing and utilities, health care, and groceries may not be impacted as badly (or at all). While others such as motor vehicles, recreational goods/services, food and accommodations, clothing, furnishings, etc. may all be deeply impacted. These areas total ~$3.6tn.
On the business side of the equation… Some areas may fare well such as software while others are impacted by delayed purchase decisions, like equipment.

Lastly, you have the Government piece… Which is likely to increase in an effort to stem losses elsewhere.

Quick Value
Best Buy ($BBY)
I think the common reaction to Best Buy is a company that has been struggling for years as consumers shift their buying online… That couldn’t be further from the truth as the company has had a good run of revenue and earnings growth since a company overhaul took place in 2012-2013.
Per share earnings have grown from $1.88 in FY14 to $6.07 in FY20, a 20% per year growth rate.

Not to make this a play on the coronavirus situation, but there is a chance the company is performing well in selling computing products, work-from-home gear, and consumer tech maintenance.
This is a $62 stock with 262m shares outstanding for a $16bn market cap.
A few other factors make this an interesting business:
The balance sheet is pristine — $2.2bn in cash, $1.2bn in debt, and $3.5bn in equity (most of which is tangible)
Online sales during FY20 were $7.6bn, nearly 20% of sales, and grew 17% for the year — online growth has been 16% annually for the past 4 years
Total Tech Support — Best Buy offers a $199.99/year subscription offering for tech support, discounted repairs, and other benefits… membership at FY20 was 2.3m and grew from 200k in mid-2018… similar to Amazon’s Prime offering and Costco’s membership model, this should bring in steady and high margin cash flow totaling ~$460m per year

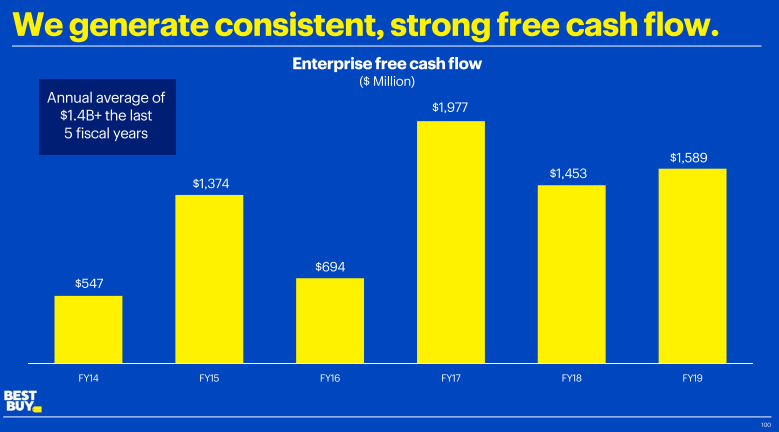
Cash flow — Free cash flow was $1.8bn ($6.95 per share) in FY20 and grew more than 10% for the year… cumulatively, FCF was $9.5bn from FY14-FY20 (about 60% of the market cap)

Buybacks and dividends — $4.5bn was spent on buybacks over the past 36 months and another $1.4bn on dividends (all without increasing debt!) — this is a cool 37% of the current market cap in total

Altogether it makes for a reasonable cheap stock at about 10x earnings / 9x free cash flow, with a solid balance sheet and some growth areas in online sales and Total Tech Support subscriptions.
