
Quick Value 3.9.20
General Electric ($GE)
Need to occasionally promote my “premium” writings which include coverage of every stock in my personal portfolio and all of my trading activity in real time…
Subscribers can check out my recent portfolio activity here. Please subscribe!
Market Performance
[Index | % change WoW ]
S&P 500 | 2972 +0.6%
Dow Jones | 25865 +1.8%
Russell 2000 | 1449 -1.8%
Russell Microcap | 539 -4%
10-Year | 0.77% -39bps
Gold | 1674 +6%
Oil | 42 -7%
VIX | 42 +5%
Did it really feel like markets were up last week??
Market Stats
With all the market turmoil, I thought it would be a good time to revisit some market fundamentals…
Estimates for 1Q20 earnings growth have really started nosedive but still look breakeven-ish YoY… seems unrealistic with the headline coronavirus impact…

And if that’s the case, then you can say goodbye to any notion of $175+ per share in S&P 500 earnings… So what if 2020 earnings are flat at $163 per share? Then at 2972 the S&P 500 may still look somewhat expensive at an 18x PE… And what if earnings contract for the year?

But then again interest rates continue to drift lower (now at 0.77%)!! Yes I know… the “PE ratio” of treasury bills is 130x! (More like 30x PE when using corporate bond rates.)
What is one to do?
My suggestion would be to get used to (much) lower returns over longer periods of time and more volatility than usual. It may not be a perfect comparison but this environment played out in Japan over the past 20 years with mixed results…
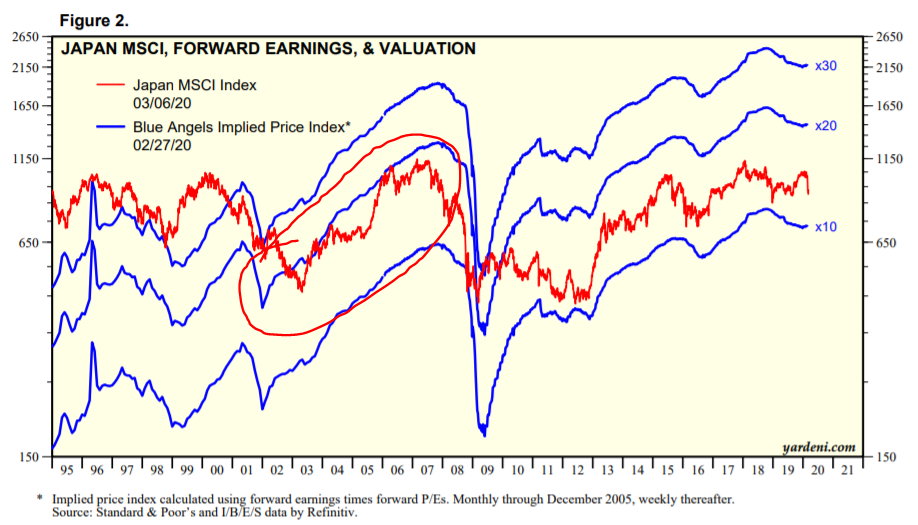
As a parting comment… here is a chart of Japanese market levels with implied earnings multiples. The highlighted section is early 2000s when Japanese equities were trading near the 20x PE range (middle blue line) and have since hovered near the 10x PE range (lower blue line).
And here you can see the Japan interest rate policy — a dedicated zero rate policy has been in effect fairly consistently since 1999… The US began its “zero rate” policy coming out of the financial crisis…

Quick Value
General Electric ($GE)
What a wild ride this stock has seen for the past 20 years! The big thing to know is that during 2018, for the first time in company history, GE brought in an outsider as its new CEO: Larry Culp from the famed execution machine, Danaher.
At the time Culp joined as CEO, it was a $10-ish stock price which is pretty consistent with today’s price. With 8.8bn shares outstanding call it an $88bn market cap.
GE has a couple of businesses, all in very different financial positions:
Power — Sales declining, negative margins, bleak outlook
Renewable Energy — Think wind turbines — Sales growing but still negative margins
Aviation — Aircraft engines and services — Solid performer
Healthcare — Diagnostics, imaging systems — Solid performer
Finance — “GE Capital” aircraft leasing + life & health — Mostly in runoff and slight detractor to business performance

The big takeaway is that cash flow is headed in the right direction… up! The other big takeaway from 2020 guidance is the improving financial condition of the company: management is dedicated to repaying debt. And a recent sale of a large part of the healthcare business should help.

GE still has a ways to go… But, generating $0.50-0.60 per share in earnings after a large divestiture isn’t bad… and debt is finally getting to reasonable levels at 2.5x net debt/EBITDA. The PE is still somewhat high at 15-19x but there’s plenty of self-help left. There’s some upside if the large and struggling Power business starts to turn the corner and backlog is starting to see improvement at +15% growth in 2019.