Quick Value 4.20.20
H&R Block ($HRB)
Market Performance
[Index | % change WoW ]
S&P 500 | 2875 +3%
Dow Jones | 24242 +2.2%
Russell 2000 | 1229 -1.4%
Russell Microcap | 447 -0.2%
10-Year | 0.64% -9bps
Gold | 1694 -3.4%
Oil | 18 -22%
VIX | 38 -10%
A quick recap of some indices YTD performance —
S&P 500 is down 11%
Russell 2000 (small companies) is down 26%
S&P 500 (equal-weighted) is down 19%
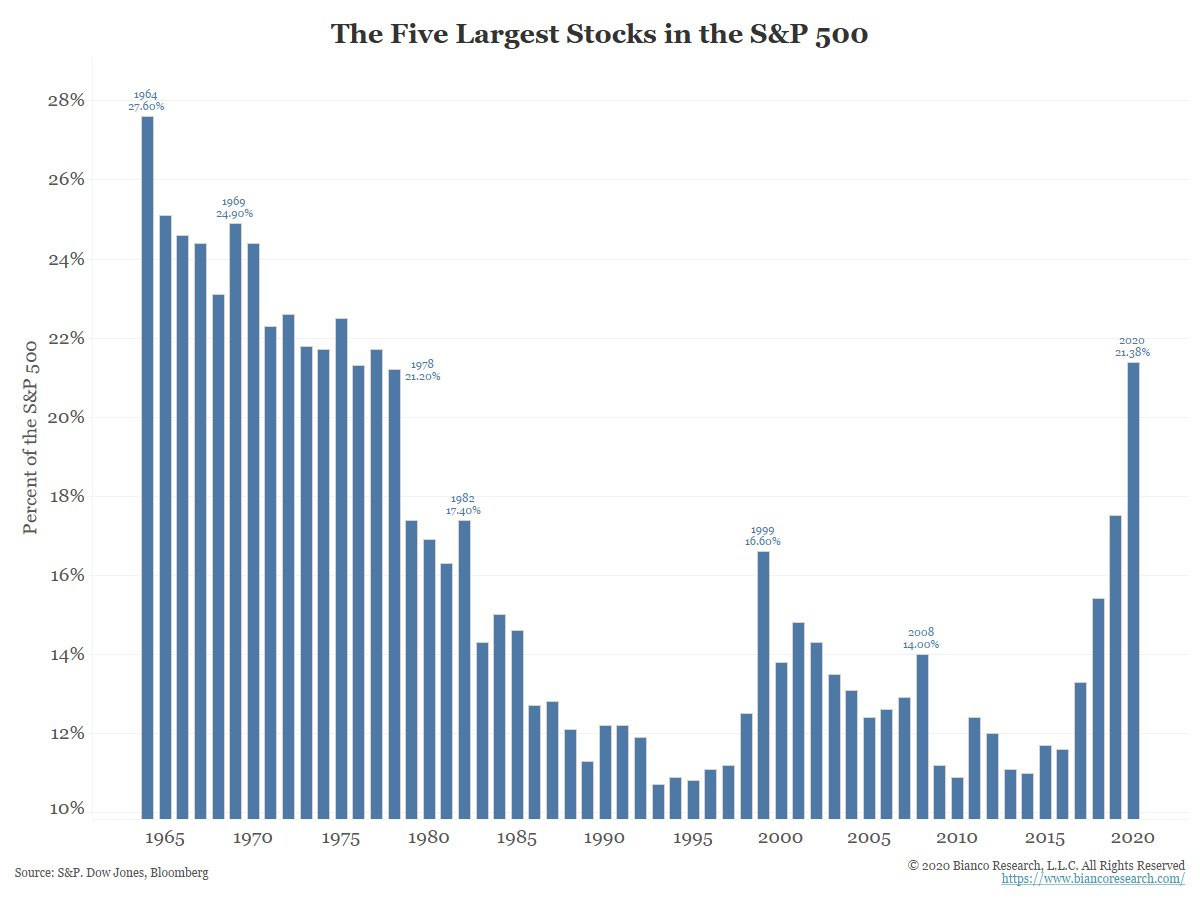
Clearly some divergence going on between larger companies and smaller companies…

Market Stats
As a quick reminder from last week’s column… Don’t fight the Fed! Money supply has inched up again to 15% YoY growth. Hard to buck the trend when a large quantity money is pumped into the system on such a short timeframe…

Going back to Econ 101 to understand why this is important:
MV = PQ
Money supply x Velocity = Price x Quantity (aka GDP)
Velocity has been on a downward trend for 2 decades and as we’ve already seen, money supply is accelerating like crazy:

You can see from the chart above that declining velocity is a relatively new phenomena for the United States that began during the Financial Crisis and subsequent Quantitative Easing program (i.e. loading up the Fed balance sheet).
So why are we jacking up money supply growth?
If we rearrange the equation to V = PQ / M (Velocity = GDP divided by Money Supply), then we’re left with the notion that our numerator (GDP) is set to fall off a cliff via COVID-19. Leaving our only choice to pump that denominator arguably as much as possible.
We know that GDP growth (P xQ) has bounced around the 2% level since the GFC…

…And we also know that inflation (P) has been at or below the 2% level since the GFC…

…Which leaves output or quantity of goods and services (Q) at some lowish level if not practically zero (P x Q = GDP).
So if Q is constant (i.e. 1.0), then GDP growth is equal to the inflation rate. And if we again rearrange our equation, we get P = MV or inflation equal to money supply x velocity.
If velocity turns, we could see large amounts of inflation and GDP growth. This event has been a long time waiting but it did recently see a nice bounce before rolling over. This is the crux of the inflation vs. deflation debate and where we are headed… Is demand for goods and services about to plummet which could cause lower price levels? How do you stimulate demand? Who cares about low rates when there is little demand for borrowing money?
Enough about money supply already!
Quick Value
H&R Block ($HRB)
This is the well-known tax franchise offering digital do-it-yourself packages as well as retail locations to help consumers do their taxes.
It’s a heavy fiscal Q4 dependent business as they earn most of their income as the tax season wraps up. The recent stimulus bill pushed back the tax filing deadline to July 15 which clearly could have some impact on cash generation.
Shares had been very stable between $20-30 for years from 2016-2020… Until recently… At $14.40 this stock is down 40% so far this year.

A little more about the business and industry…

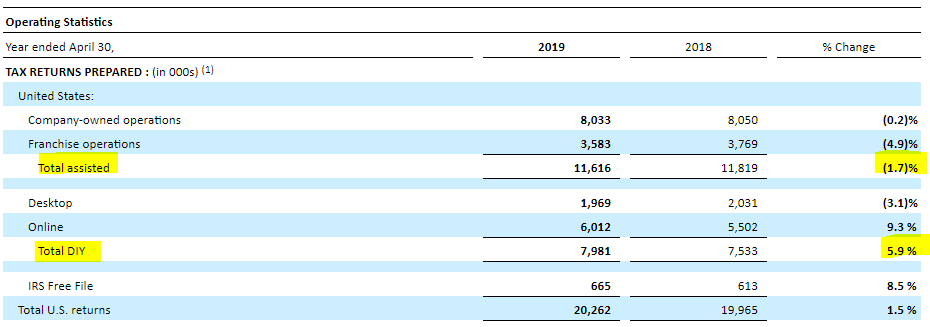
There are a few segments of the tax prep market — from Assisted (completely outsourced) to digital DIY (completely on your own). The ol’ Pen & Paper is just about gone and even the Assisted market (think: your local H&R Block store or Jackson Hewitt location) has been in decline.

Intuit does us a favor and breaks out retail stores and CPA prep:

The big problem with H&R Block is that much of their revenue comes from the Assisted channel (i.e. their retail stores) — 60% of total sales in FY2019. This segment has been in decline for years now with its only saving grace having been price increases.

Average filing fees for assisted returns are $215-230 while DIY is only ~$33. So even though 8m returns were filed DIY vs. 11.6m Assisted, the revenue mix is much heavier in favor of Assisted ($1.8bn vs. $260m).
The big wrinkle now are shutdowns impacting storefront operations. Stay-at-home orders make it difficult to drop-in to your local H&R Block branch to get your taxes done. A key potential risk.
What about some financial details?
There 193m shares outstanding x $14.40 stock price = $2.8bn market cap. They have $2.5bn in debt and just shy of $200m in cash as of 1/30/20 (their fiscal Q3 end). Remember, over 100% of cash flow is generated during Q4 — there are $1.5bn in cash outflows through Q3 but the past 3 years have had an average cash inflow of $670m.
This means there is likely some $2bn+ in cash coming during the 1/30/20 to 7/15/20 period — the delayed tax deadline could delay the typical cash inflow timeline.
So what makes this interesting?
For starters — the business held up extremely well during the GFC — total assisted filings fell 6% per year from 2008-2010 (DIY grew during this period) while total operating cash flow was positive each year and totaled $1.8bn ($620m per year average).
Next up is the consistent cash generation — over $500m ($2.60 per share) last year — this is a roughly 5.5x price to free cash flow multiple.
Don’t forget the digital DIY offering is growing — digital filings up nearly 6% in FY2019 and 11.5% through 3Q20.
Most of this cash goes back into shareholder hands — $200m each year funds the 7% dividend yield and $520m in share repurchases from 2017-2019.
Lastly, HRB acquired Wave Financial for $405m in mid-2019 — it’s a rival to Intuit’s QuickBooks Online product with a “free” price tag — they generate revenue from payment processing, payroll, and monthly bookkeeping services — it could make for improved revenue growth longer term
