
Quick Value 4.27.20
Cigna Corp ($CI)
Market Performance
[Index | % change WoW ]
S&P 500 | 2837 -1.3%
Dow Jones | 23775 -1.9%
Russell 2000 | 1233 +0.3%
Russell Microcap | 455 +1.8%
10-Year | 0.6% -4bps
Gold | 1744 +3%
Oil | 17 -6%
VIX | 36 -5%
Small caps played a bit of catch-up over the past week as the S&P 500 and Dow dropped…
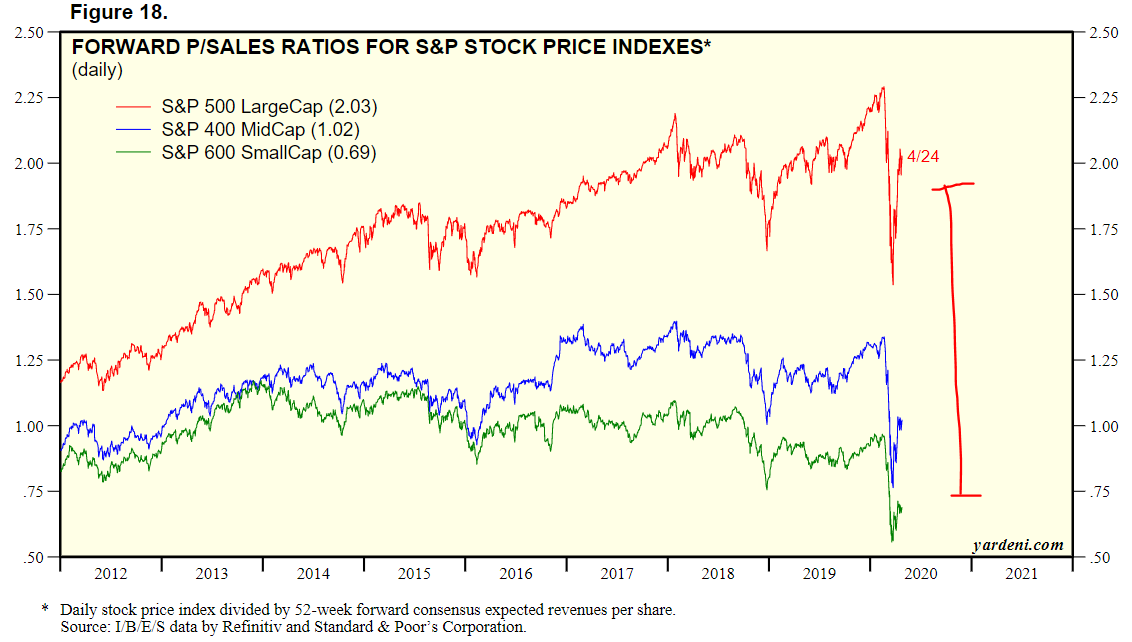
This chart of forward price-to-sales ratios for large, mid, and small-cap indices highlights the growing divergence of these companies over the past few years:
Market Stats
More market fundamentals…
Here are your updated S&P 500 earnings figures (as of 4/17) per FactSet:

Estimates from Yardeni are consistent…
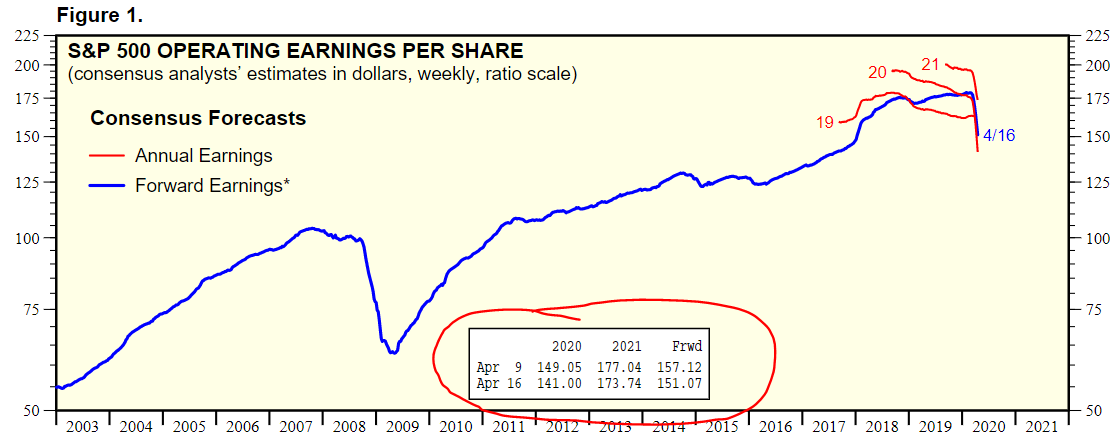
This indicates a 12-13% decline in EPS for the S&P 500 from $163 in 2019 to $143 in 2020 (obviously subject to change as companies have been releasing earnings)…
With the S&P 500 at 2837 this gives it a 19.8x PE on those 2020 estimates.
Not much of a bargain… An estimated 21% rebound in 2021 to $173 might be a stretch as well.
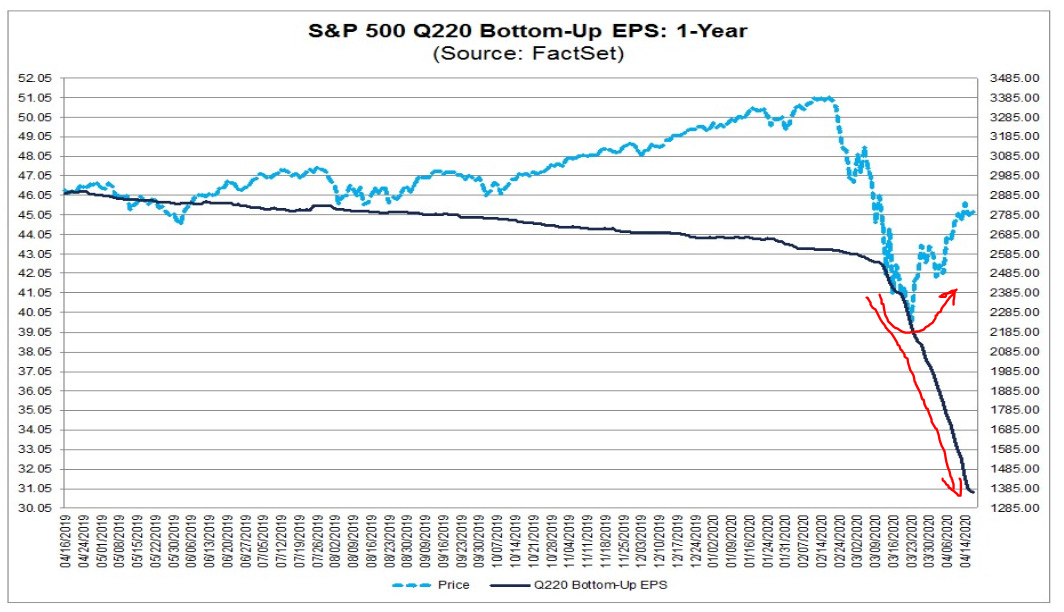
The old adage that stock prices follow earnings makes things even more confusing as the 2 have diverged as of late…
Don’t forget that “our” ability to forecast earnings isn’t great either… Downward revisions are the rule, not the exception…

The long-term average PE ratio for the S&P 500 is about 16x, so:
At $143 EPS = 2288
At $173 EPS = 2768
We breifly touched the low point on 3/23/20 when the S&P hit 2237… These ranges don’t seem far-fetched…
Quick Value
Cigna Corp ($CI)
Cigna is a commercial health insurer and Medicare provider. More recently, in 2018, they acquired their way into the pharmacy benefits management (PBM) business via Express Scripts.
There are 372m shares x $188 stock price = $70bn market cap. Net debt is about $33bn for a $103bn enterprise value.
Cigna generated $9.5bn in cash flow and spent $1bn on capex in 2019 for $8.5bn in free cash flow. Management projects another $7bn in FCF on average for each of 2020-2021. Call it 10x price to free cash flow.

For comparison, CVS Health ($CVS), is probably the closest rival after they acquired health insurer Aetna in 2018. This makes CVS a combination of health insurance, PBM, and retail drug stores. CVS has an $81bn market cap and guided to $8-8.5bn in free cash flow for 2020.
This gives both Cigna and CVS a similar 10x FCF multiple.
However, they differ in a few ways that make Cigna appealing:
CVS carries 2x the debt load at $60bn+ or 7x debt/FCF while Cigna’s balance sheet is less full at $33bn net debt or 4.7x debt/FCF…
Cigna pays only a token dividend (< $200m) while CVS is committed to $2.6bn in dividend payments each year — this will make it much harder for CVS to quickly reduce debt levels
Cigna is very close to reaching it’s debt target (likely coming in 2020) and has virtually no fixed cash commitments in dividends or buybacks — this leaves room for the company to fully utilize its $7bn in FCF to benefit shareholders… in fact, they could buy back ~10% of the company each year at that pace…
So there you have it, a relatively clean balance sheet with cash flow fully available for the benefit of shareholders… The company is targeting 10%+ earnings growth while trading right around 10x earnings today…
