Quick Value 5.30.23 ($MTZ)
MasTec - growing E&C compounder at 11x owner earnings
Hope everyone enjoyed the long weekend… enjoy today’s free post on MasTec and don’t forget to subscribe:
Market Performance
Market Stats
Inflation seems to be talk of the town as YoY increase is stabilizing if not turning higher (using Core inflation measure)… makes some sense as wages still growing above average, unemployment low, and housing doing well…
Quick Value
MasTec Inc (MTZ)
At a recent investor presentation, MasTec CFO led with EBITDA growing from $59m in 2007 to $1.1bn in 2023 (guidance)… that’s a 20% CAGR and pretty impressive considering minimal dilution since 2007-2008 (if any).
He then went on to detail the 4 well-diversified segments and why the company is strongly positioned for years ahead. Throw in an owner-operator CEO and you have the makings of a potentially high quality business (some folks refer to them as “compounders”).
What they do…
MasTec is a traditional engineering and construction (E&C) firm with 4 segments:
Communications — Everything from laying fiber in the ground to building and maintaining wireless towers; this segment plays to the large sum of annual capex at AT&T, Verizon, T-Mobile, etc.
Clean Energy & Infrastructure (CE&I) — Probably needs to be further split up… this segment includes both civil work (like roads and bridges) and energy-related work such as building solar/wind farms, and other renewable/non-renewable projects.
Power Delivery — Anything tied to transmission and distribution work at utility customers… again, tied to significant annual capex by customers.
Oil & Gas — Building and maintaining oil and gas pipelines… this segment was once viewed as the core upside driver but lately it’s just trying to get back to historic revenue levels.
Don’t confuse this as a company that only does big construction projects. There’s a service and maintenance component in there too (51% of 2022 revenue) which is good recurring revenue.
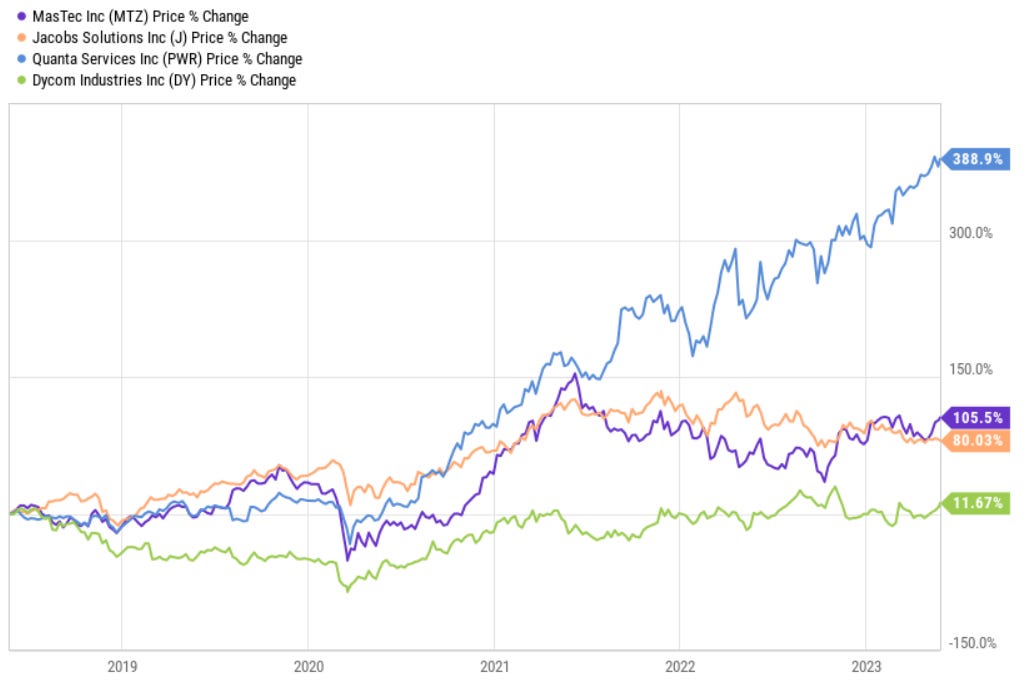
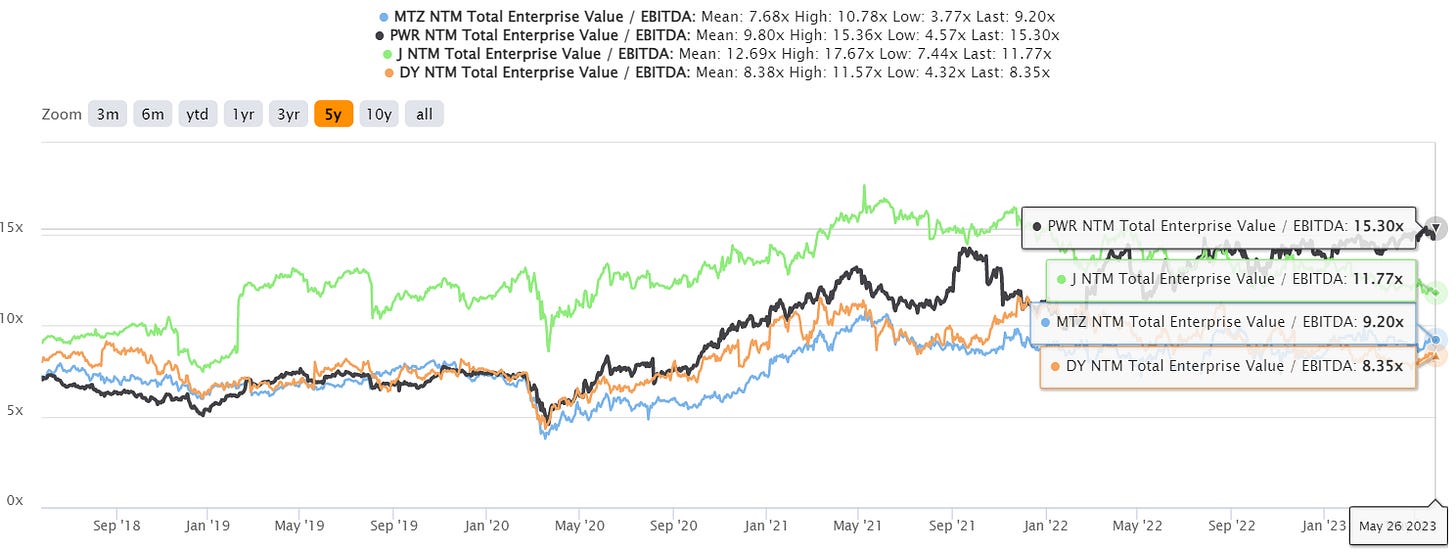
Over the last 5 years, MTZ has outperformed most of their peer group (aside from PWR which I may need to look at next week). Yet the stock trades at a discount to most of the group (9.2x forward EBITDA).
Stock price performance vs. peer group
Valuation vs. peer group:
Growth seems to be the name of the game here…
Revenue CAGR is >16% from 2019 ($7.2bn) to 2023 guidance ($13.1bn) and EBITDA following suit… here’s a breakdown of performance by each segment going back to 2017.
A few quick comments on this performance:
Pipeline segment (oil and gas) is way below revenue/EBITDA highs — specifically, there’s a ~$400m delta from 2023 EBITDA to 2019… I haven’t dug deep enough to understand how margins held up when revenue fell 2019-2021
Clean Energy (CE&I) and Power Delivery segments benefitting from string of acquisitions in 2021-2022
CE&I segment still probably underearning at “mid single digit” margins — could be a 7-8% margin business if history serves and once they work through integration efforts
I’ve only read the latest earnings call but it’s littered with comments on industry growth… wireless spending on 5G, infrastructure bill expansion of rural fiber buildouts, new cell towers and small cell, EV charging, renewables in solar/wind/etc. Lots of good things happening in these end markets and Government support to boost them.
Sales outlook is ~$13bn for 2023 and $15.5bn in the “near-term” so it may be early to start calling a peak. My guess is investors will start to wonder when or whether these good times will come to an end. These projects take a long time to start and a long time to complete and end markets are heavy spenders… other than the cyclical nature of project/construction spend, this is a party that could last for a long time…
EBITDA is great but does it turn into cash flow?
FCF was a cumulative $2.6bn from 2016-2022 (vs. current market cap at $7.6bn). At first glance that doesn’t seem very cash generative, only averaging $372m during that 7-year stretch.
Growing topline by 2x is naturally going to consume a lot of cash though. These businesses are more working capital intensive than capex intensive (i.e. lots of labor and receivables).
On the capital allocation front, they’ve periodically acquired targets of various sizes with big purchases in both 2021 and 2022 (~$1.9bn spent). Buybacks look tied to lower share price / valuation (~$500m spent in 2018, 2020, 2022). Deleveraging back to 2x or lower seems to be the top priority as they digest these recent acquisitions.
What could MTZ be worth?
Shares are flat since March 2021 but they’ve added some hefty acquisitions and organic growth since then…
FCF isn’t the best metric with such rapid organic growth consuming cash and EPS has a huge depreciation component in it which doesn’t reflect true capex needs…
Using Buffett’s owner earnings metric (i.e. net income plus D&A less capex) nets a little over $700m in owner earnings based on 2023 guidance or $9.11/share (<11x multiple). Owner earnings was $7.14/share in 2019 (+6% CAGR) and $2.39/share in 2016 (+21% CAGR).
This year’s numbers include an underperforming pipeline segment and an underearning clean energy & industrial segment… So maybe some earnings upside if/when those improve.
MTZ has averaged 14-15x P/E over the past 10 years and using that same multiple on owner earnings nets a potential price of $130/share. Not huge upside from current share price but still plenty of momentum ahead…


Sounds like the real upside to earnings will come from oil & gas capex. Same story as Boustead Singapore, which I've covered in the past.