Quick Value 8.31.20 (EIGI)
Endurance International (EIGI)
Market Performance
New format this week with a goal of seeing the weekly trend in index levels…

Last week was still a strong one with most indices up >2-3%…
Market Stats
My favorite economic release came out last week!
Once again, consumer finances remain strong (as of July that is)…
Personal income came out to an annualized rate of ~$17.9tn — this is basically flat from the June rate — if you look deeper you’ll notice a baseline in disposable income existed prior to COVID right around the $16.5tn mark from December to March…
With stimulus efforts in full swing, disposable income has been closer to $17-18tn (annualized) from April to July.

I’ll reiterate again — most headlines have talked about rampant spending as stimulus checks hit consumer bank accounts — but the data shows that consumers have been saving more and spending more… the only way this has been possible is because they’ve been earning more as well.
Will this come to a sudden end when the August data is released? As a reminder, the bonus unemployment benefits ended on 7/31 but the President signed an executive order replenishing some of those benefits in August…
What else?
The housing market is hot!
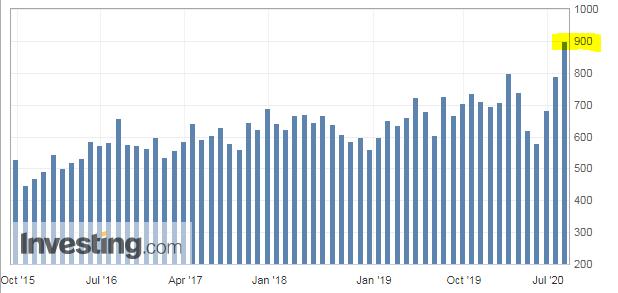
Sales of new homes are hitting highs we haven’t seen in years…

And lumber prices are there too…

Lastly, your gut check on market forces — money supply growth remains strong and has not eased up…

Quick Value
Endurance International (EIGI)
As a user and former user of certain Endurance products, I wanted to dig into this stock in this week’s post…

From $20+ to < $10 per share… Yikes…
Here’s the basic gist of what Endurance does:

This is a collection of brands such as Constant Contact, HostGator, ecomdash, and Bluehost, and Domain.com… They have >5m subscribers across their hosting, email marketing, and domain segments generating >$1bn in annual revenue.
Endurance has grown significantly through acquisitions over the years and as such, they carry a large debtload… Part of the recent problems was the $1bn+ acquisition of Constant Contact in 2015 that added a big chunk of debt and <$40m in annual free cash flow at the time.
This is a $6.50 stock with 141m shares = $915m market cap… Add ~$1.6bn in net debt and you have a $2.5bn enterprise value.
Like other stocks I enjoy, cash flow is tremendous:
2017 — $123m in FCF
2018 — $136m
2019 — $158m
TTM — $134m
Less than 10x P/FCF no matter which period you’re looking at!
They’ve used this cash almost entirely to pay down of ~$410m over the past 3.5 years so they’ve certainly shifted to improving the balance sheet.
Endurance is still paying more than $140m per year in interest expense… Just highlights how a massive debt paydown effort could add to cash flow over time.
EBITDA over the past 12 months is about $315m… With $1.6bn in debt this is ~5x leverage and 7.9x EV/EBITDA
Fortunately, subscriber trends have been flattening out and even starting to improve recently (thanks COVID?). This would be massively helpful to maintain the stable cash flows necessary to repay debt.

One final interesting tidbit…
Another web hosting and domain business (Web.com) was acquired in 2018 for $2bn on ~$750m in sales = 2.7x EV/Sales acquisition price. Not to say Endurance is worth this multiple but even today that would equate to a $10+ share price.
A lot of uncertainty and debt risk but a sticky customer base with good cash generation could make for an interesting deleveraging play…
