
Quick Value #316 - MasterBrand Inc (MBC)
Recently closed all-stock merger with AMWD creates largest player in cabinet industry
Today’s post:
Recently closed all-stock merger between MBC & AMWD
Creates largest industry player at weak point in housing market
Pro-forma, shares trading at 7.7x trough EBITDA (incl. synergies)
For new subscribers — these write-ups are meant to be a “jumping off point” for the idea generation process (i.e. a surface level review). Each write-up includes: 1) company background; 2) why the idea is interesting; and 3) fair value estimate.
Check out past write-ups here and my home base page here.
Recent write-ups include:
05/31/26 — A case study of a stub business investment
05/26/26 — My 4 favorite special sits right now ($)
05/18/26 — Former compounder Zoetis looks beaten down
05/11/26 — Sale + spin at Enviri ($)
05/01/26 — Ice cream spin-off Magnum looks cheap
04/21/26 — Guide to analyzing “asset plays”
REMINDER: Prices are going up tomorrow! Subscribe today to lock in current pricing of $20/month or $200/year.
Quick Value
MasterBrand Inc (MBC)
Ticker: MBC
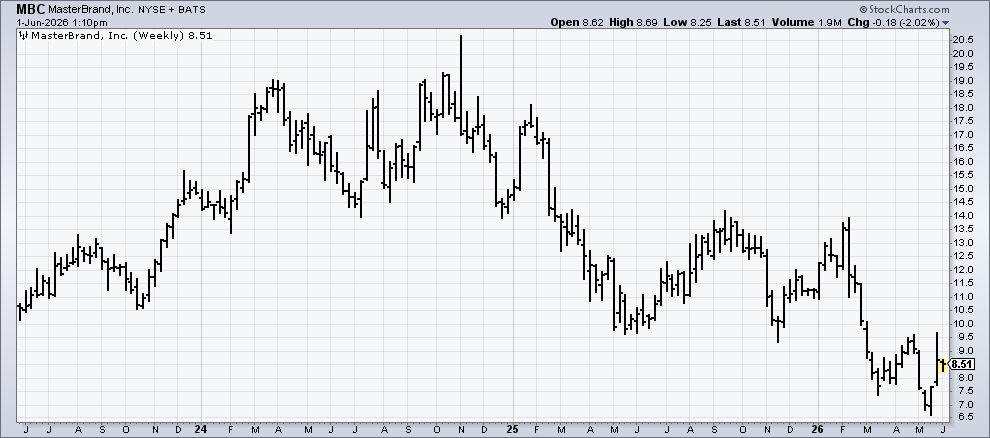
Price: $8.50
Shares: 208m (post-merger)
Market cap: $1.77bn
Valuation: 9.9x EBITDA (ex-synergies) / 7.7x (post-synergies)
Theme: M&A
MBC and AMWD recently completed an all stock merger, which seems fitting for a special situations focused newsletter like this one.
Background
The housing market is in the dumps, but apparently Buffett (Abel?) is buying; at some point this industry will turn the corner, right?
Industry overview
Both MBC and AMWD manufacture and sell kitchen cabinets.
The cabinetry industry is a roughly $18-20bn market with 2/3 sales coming from the repair and remodel segment, and 1/3 sales coming from new home construction (MBC Form 10 filing, 2022).
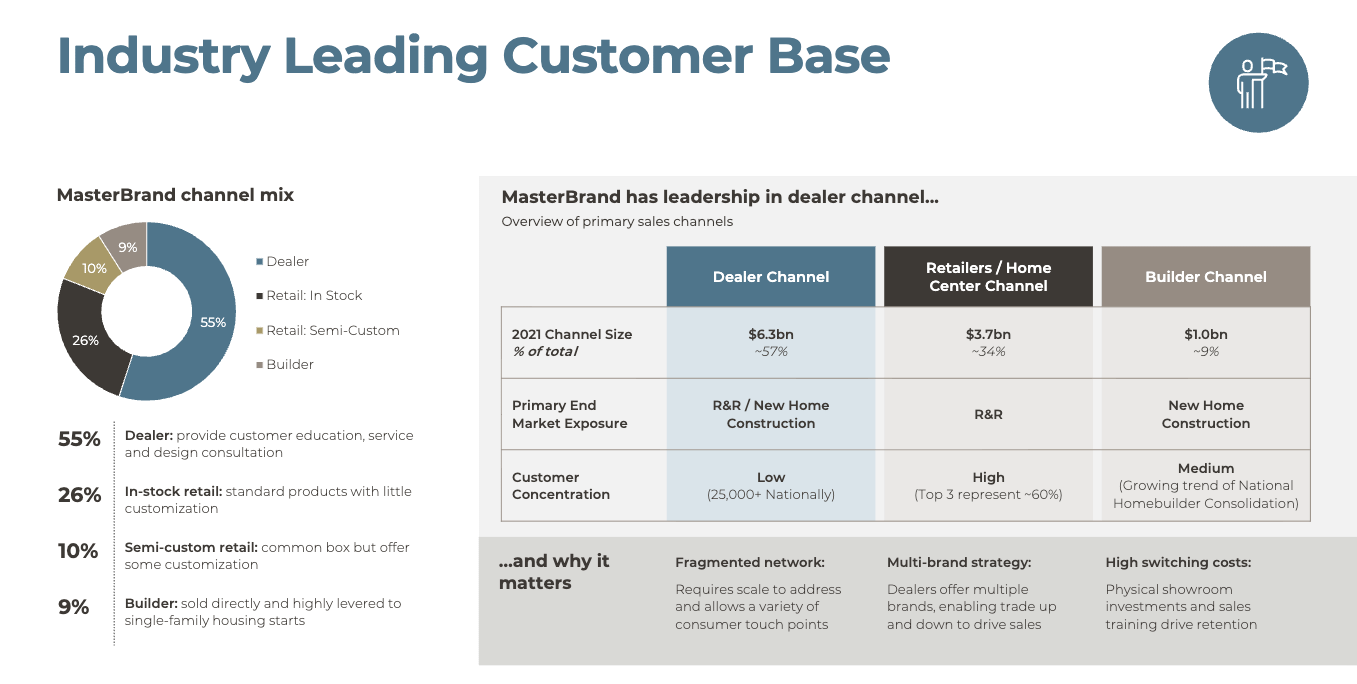
Cabinets are sold primarily through 3 distribution channels (from MBC 2022 investor day):
Dealers (57% of industry sales) — Network of 25,000 dealers (ex: Ferguson Home) operate showrooms, provide design services, and “educate” consumers on product options. Services both R&R and new construction markets.
Big box retailers (34%) — Dominated by Lowe’s / Home Depot (i.e. a very concentrated sales channel) and services mainly the R&R market.
Builders (9%) — Homebuilders serving new construction market. Switching costs are high(er) in this channel.
This industry is dependent on both the housing market and overall consumer sentiment.
A closer look at the housing market:
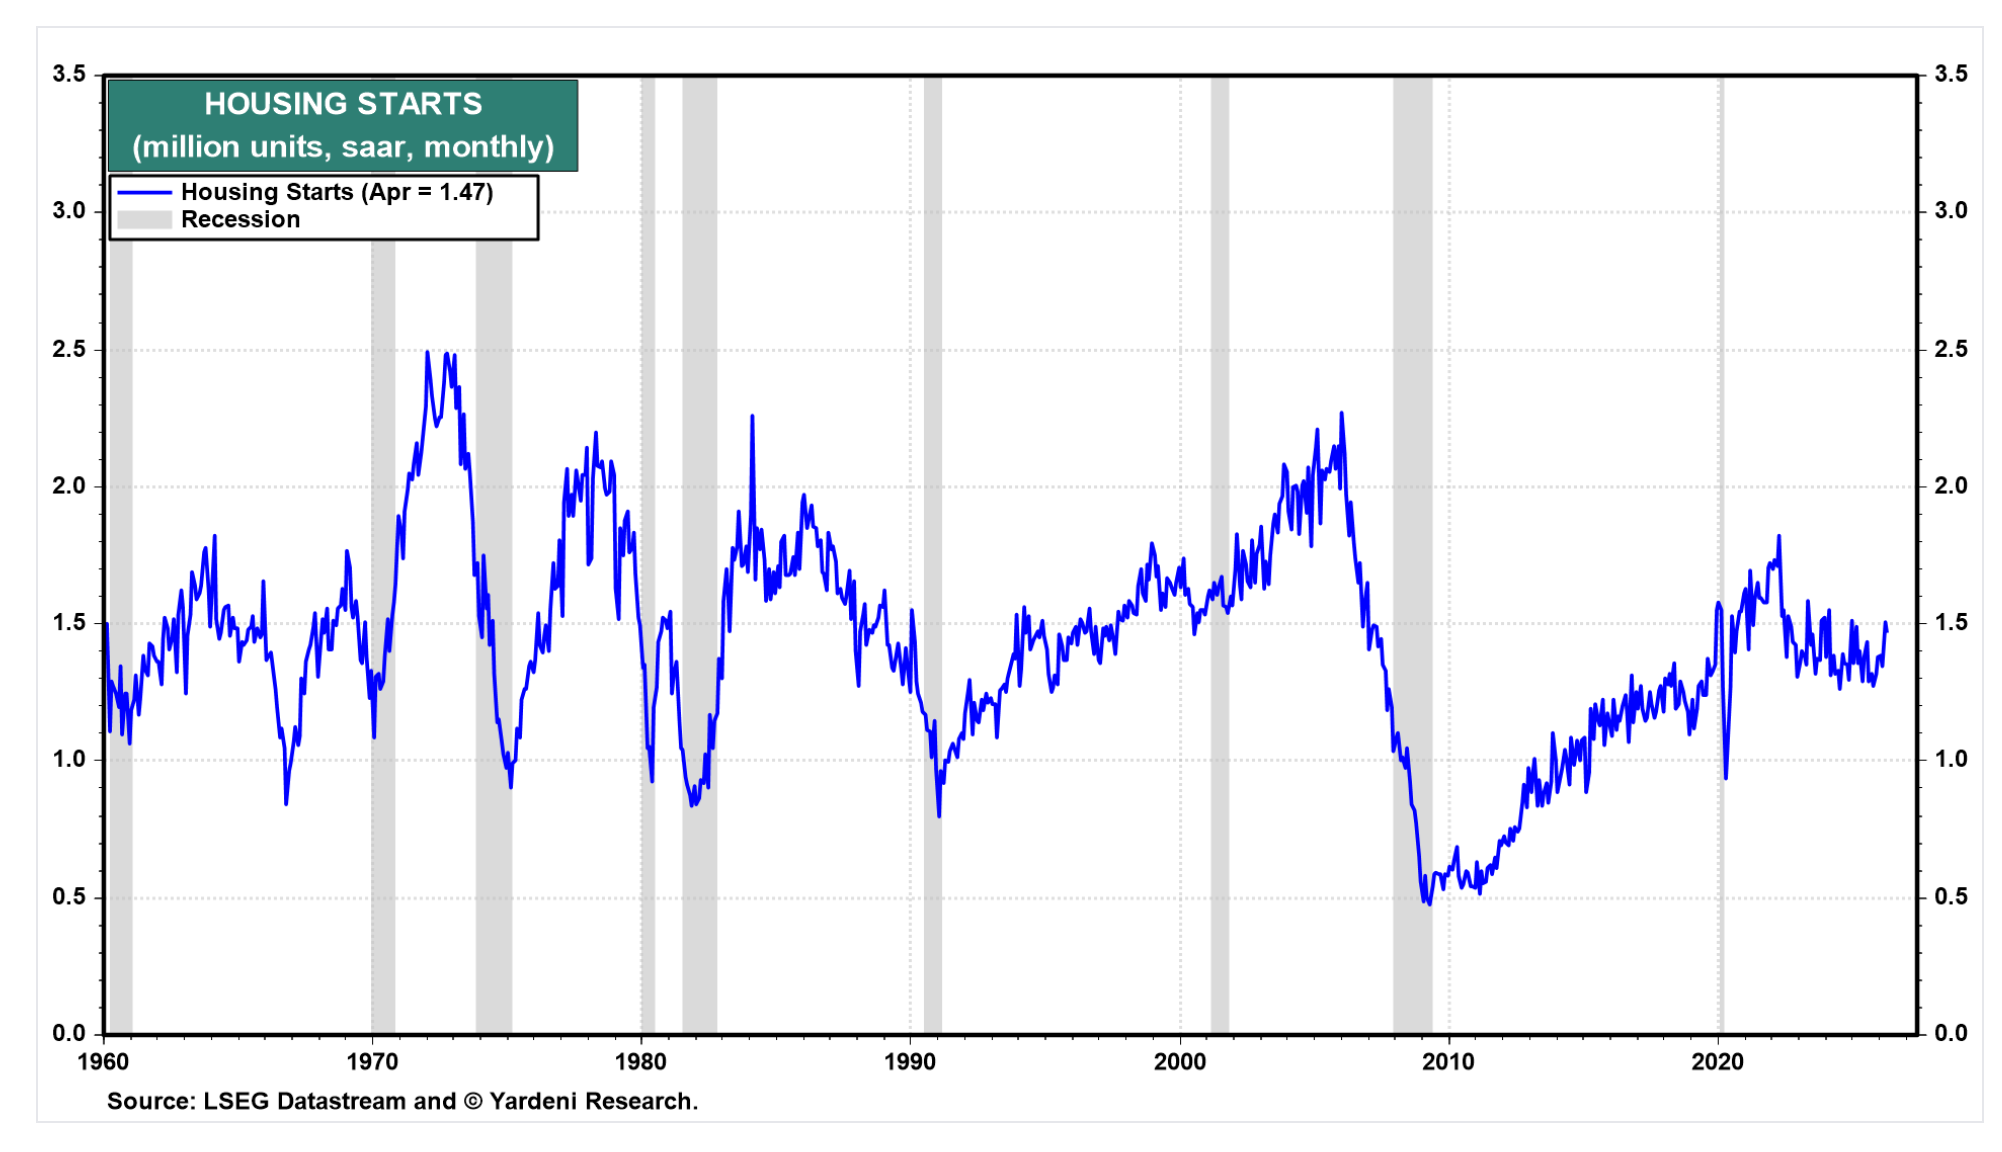
Housing starts are a measure of new home construction and, after a strong post-GFC rally from 2010-2020, things are starting to cool off after a pandemic surge:

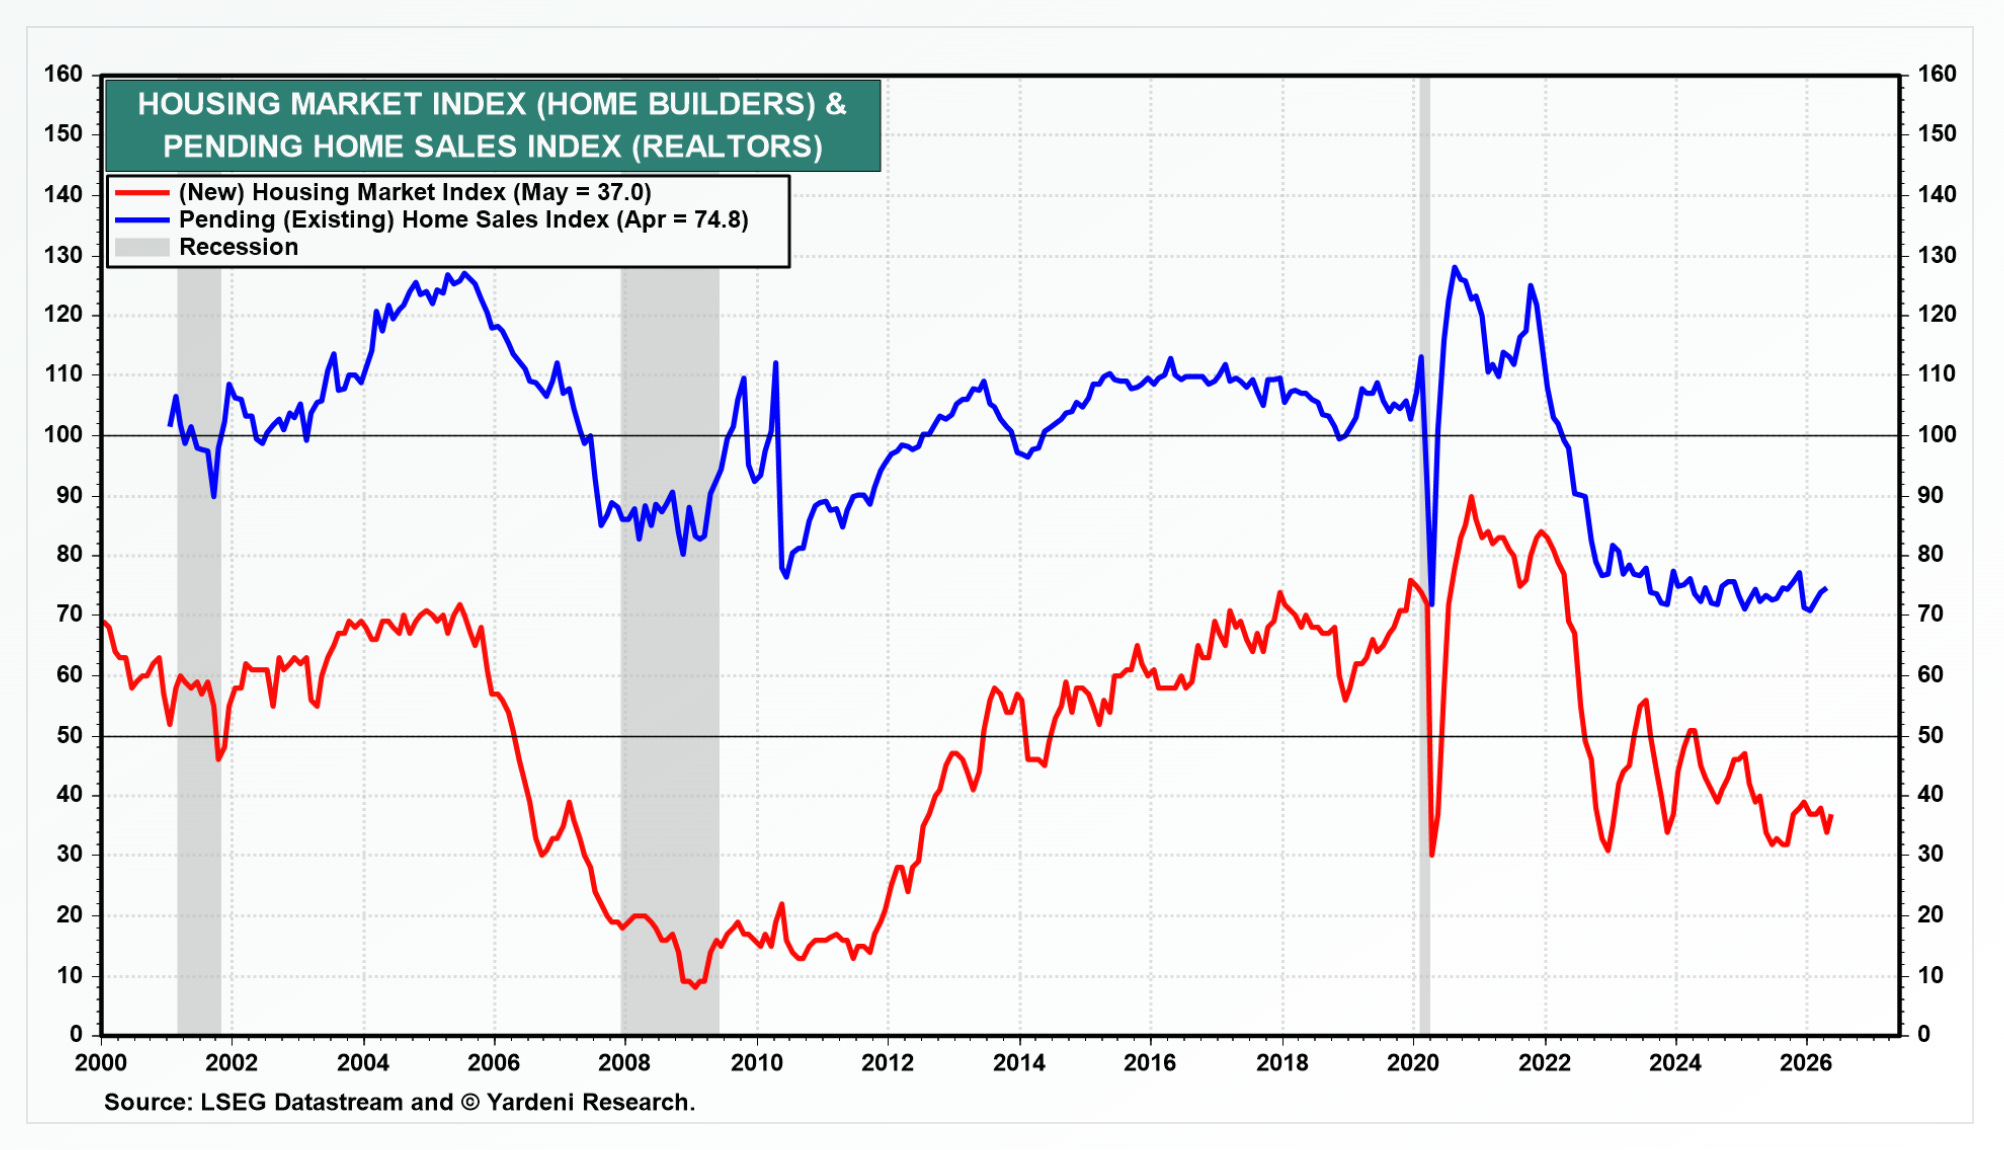
Housing starts (Yardeni) Then you have existing home sales, which measures sale activity for already-built homes. Existing home sales aren’t quite at GFC-era lows, but they’re not far off.

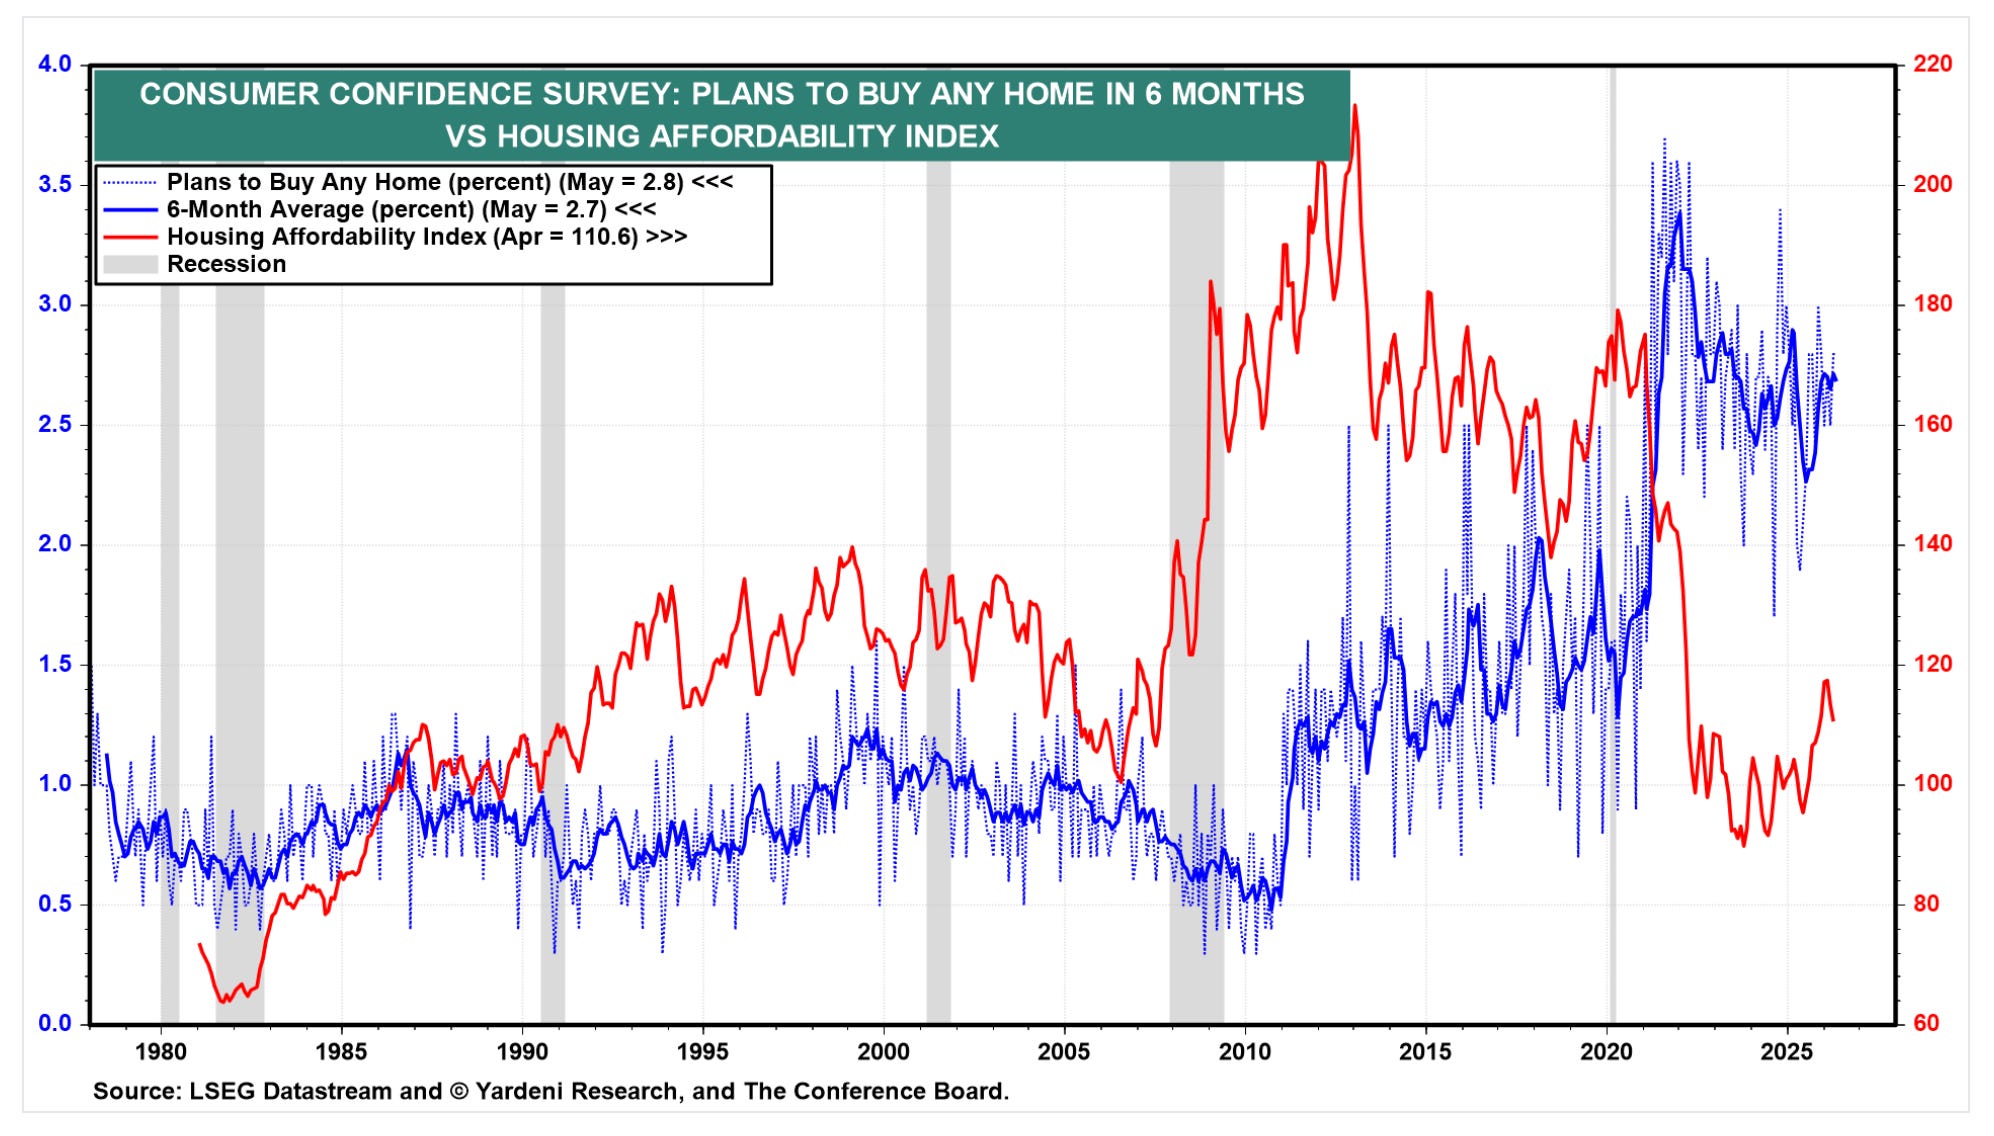
Housing market index (builders) vs. existing home market (realtors) (Yardeni) Both new home sales and existing home sales are largely a function of affordability (i.e. rates). Housing affordability (red line) is way down from the 2010-2020 period of ultra-low mortgage rates. Consumers planning to buy a new home (blue line) are down from the start of the pandemic, but elevated compared to history.

Housing affordability & plans to buy a home (Yardeni) Last, you have consumer sentiment, which is a key driver of the repair and remodel market. When consumers are feeling good and flush with cash, they’re more likely to spend on a kitchen remodel. Lots of macro variables feed into consumer health: wage growth, savings rate, consumer sentiment, housing, affordability (mortgage rates), credit availability, inflation, etc.
Most of these charts point to concerning trends.
If we look at the inventory of homes available, both new & existing homes are on the rise, there are ~10 months of new home supply and ~4.4 months of existing home supply on the market. (Note: new home monthly inventory is very close to GFC levels.)
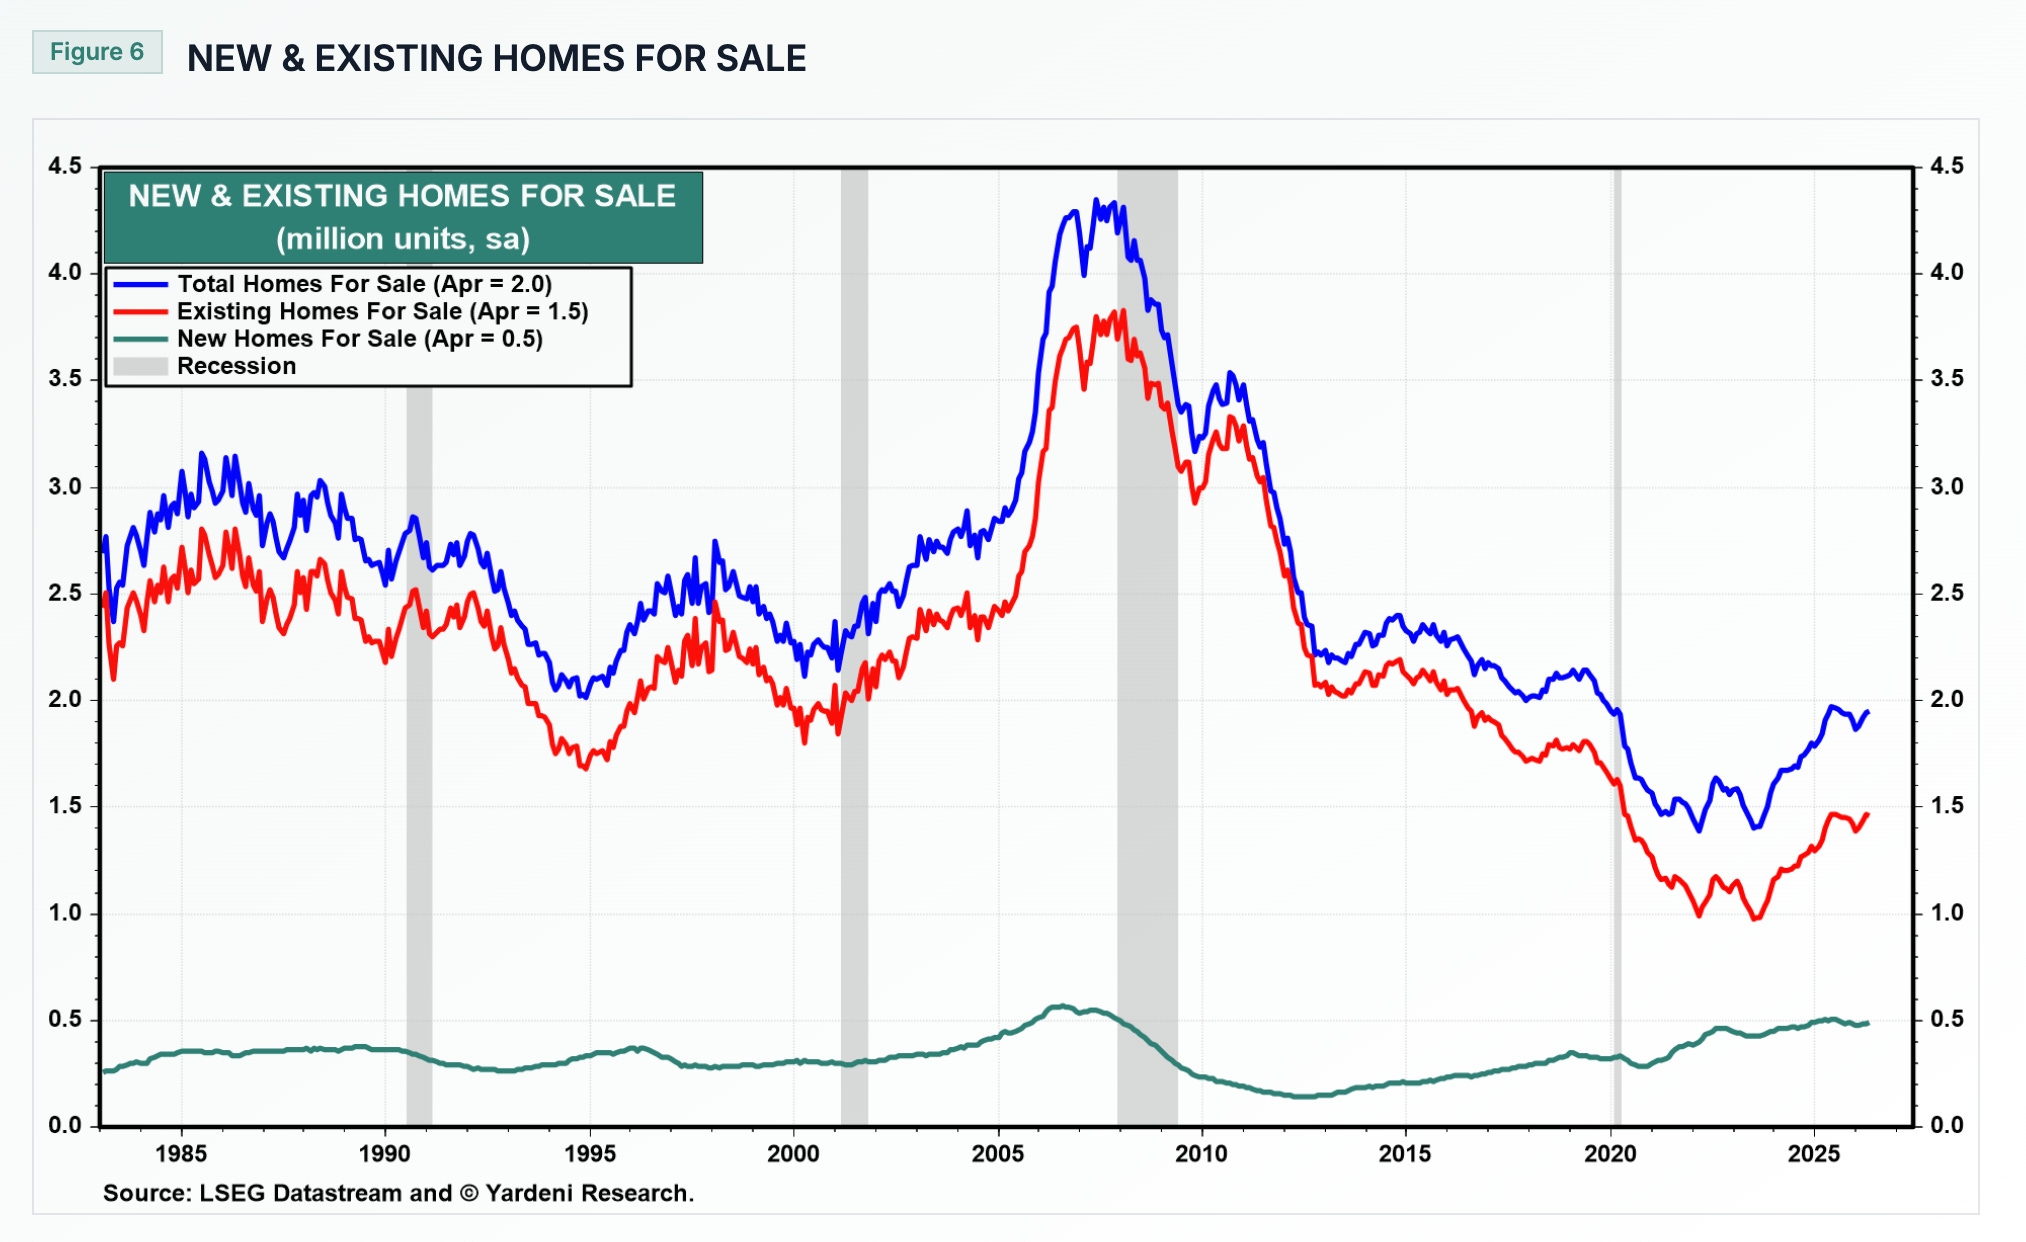
These charts point to a demand problem, not a supply problem.
Fortunately, it’s easier to fix a demand problem…
The largest 2 factors being rates & prices.
Home prices are already falling across the new construction market and in certain markets for existing homes.
Mortgage rates are at pre-GFC levels (high), but they’ve stabilized and are down slightly from post-pandemic highs.
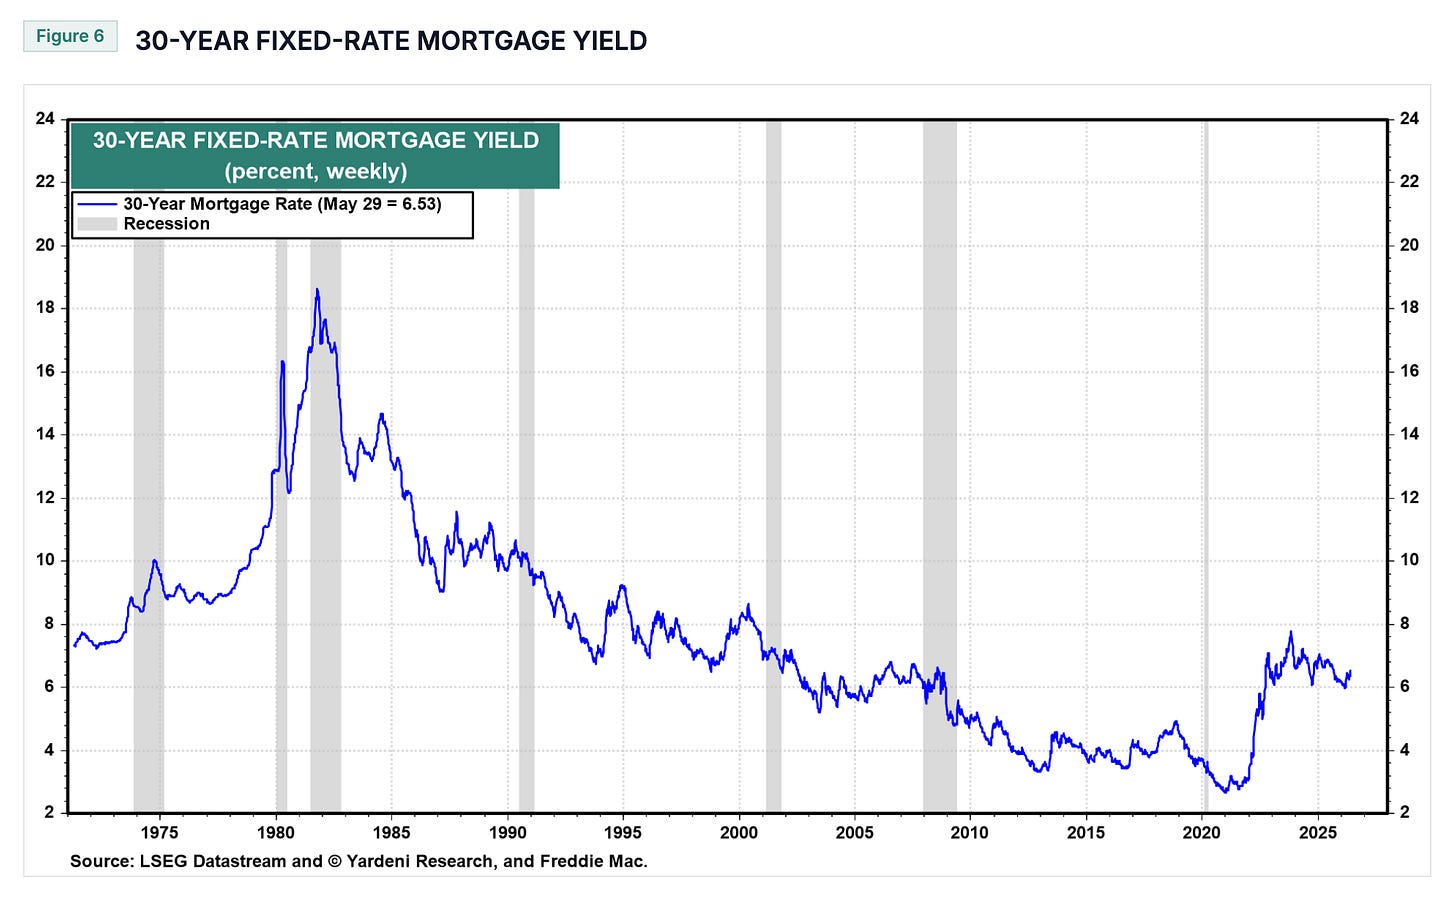
30-year mortgage rates

I used lots of charts to highlight what MBC management described very succinctly in their Q1 2026 earnings call:
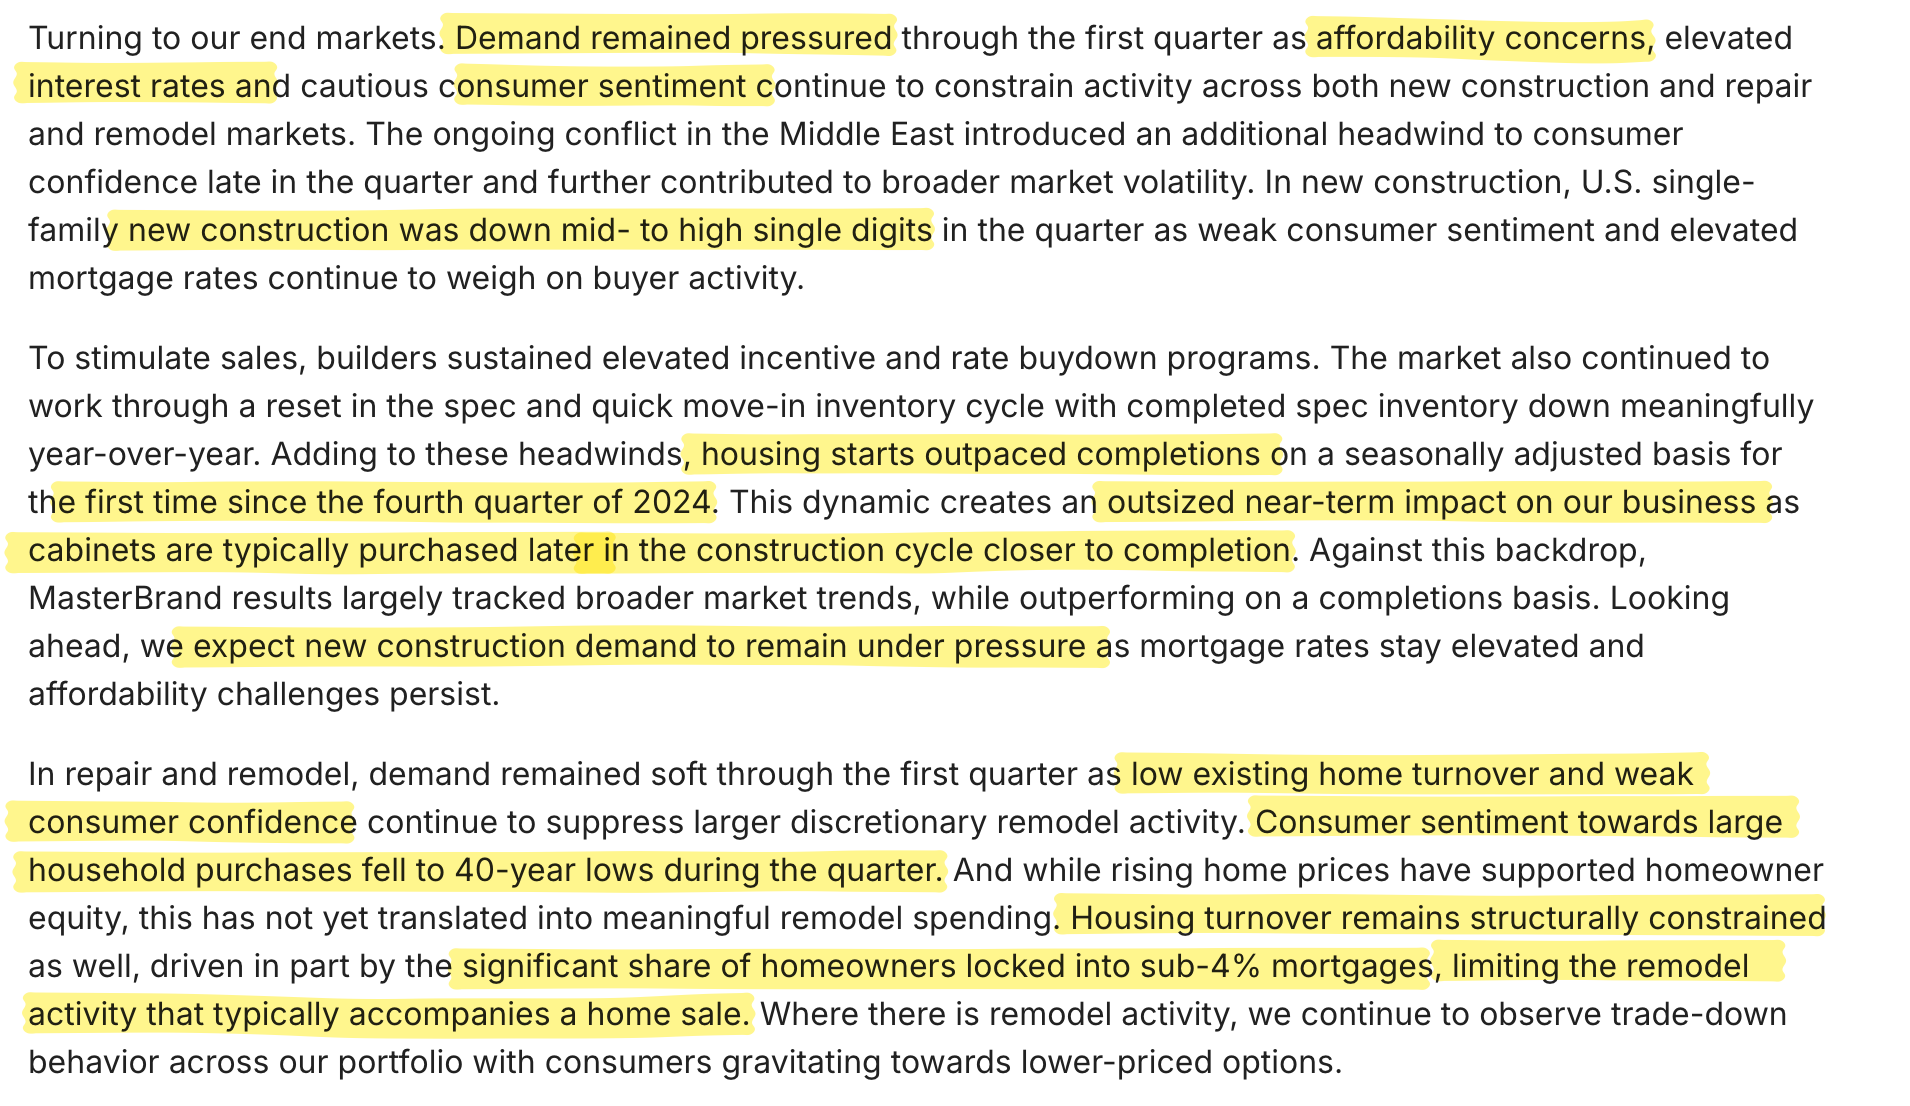
Why it’s interesting…
This is an all stock merger creating the industry’s largest player with ~30%+ market share at a time when the housing market is searching for a bottom.
From a valuation standpoint, pro-forma shares are trading at a depressed multiple of near-trough numbers.
Since the housing market is facing demand-side problems, it’s hard to say that 2026 will be the bottom. So instead, I’d like to understand the business and what earnings could be under “normal” market conditions to see whether we have an attractive setup here.
The merger
At the time of announcement, MBC was trading at $12 and AMWD at $62. As of today, MBC trades at $9 and AMWD closed at $48, both down 20-25% each.
This is one of those “makes a ton of sense” mergers.
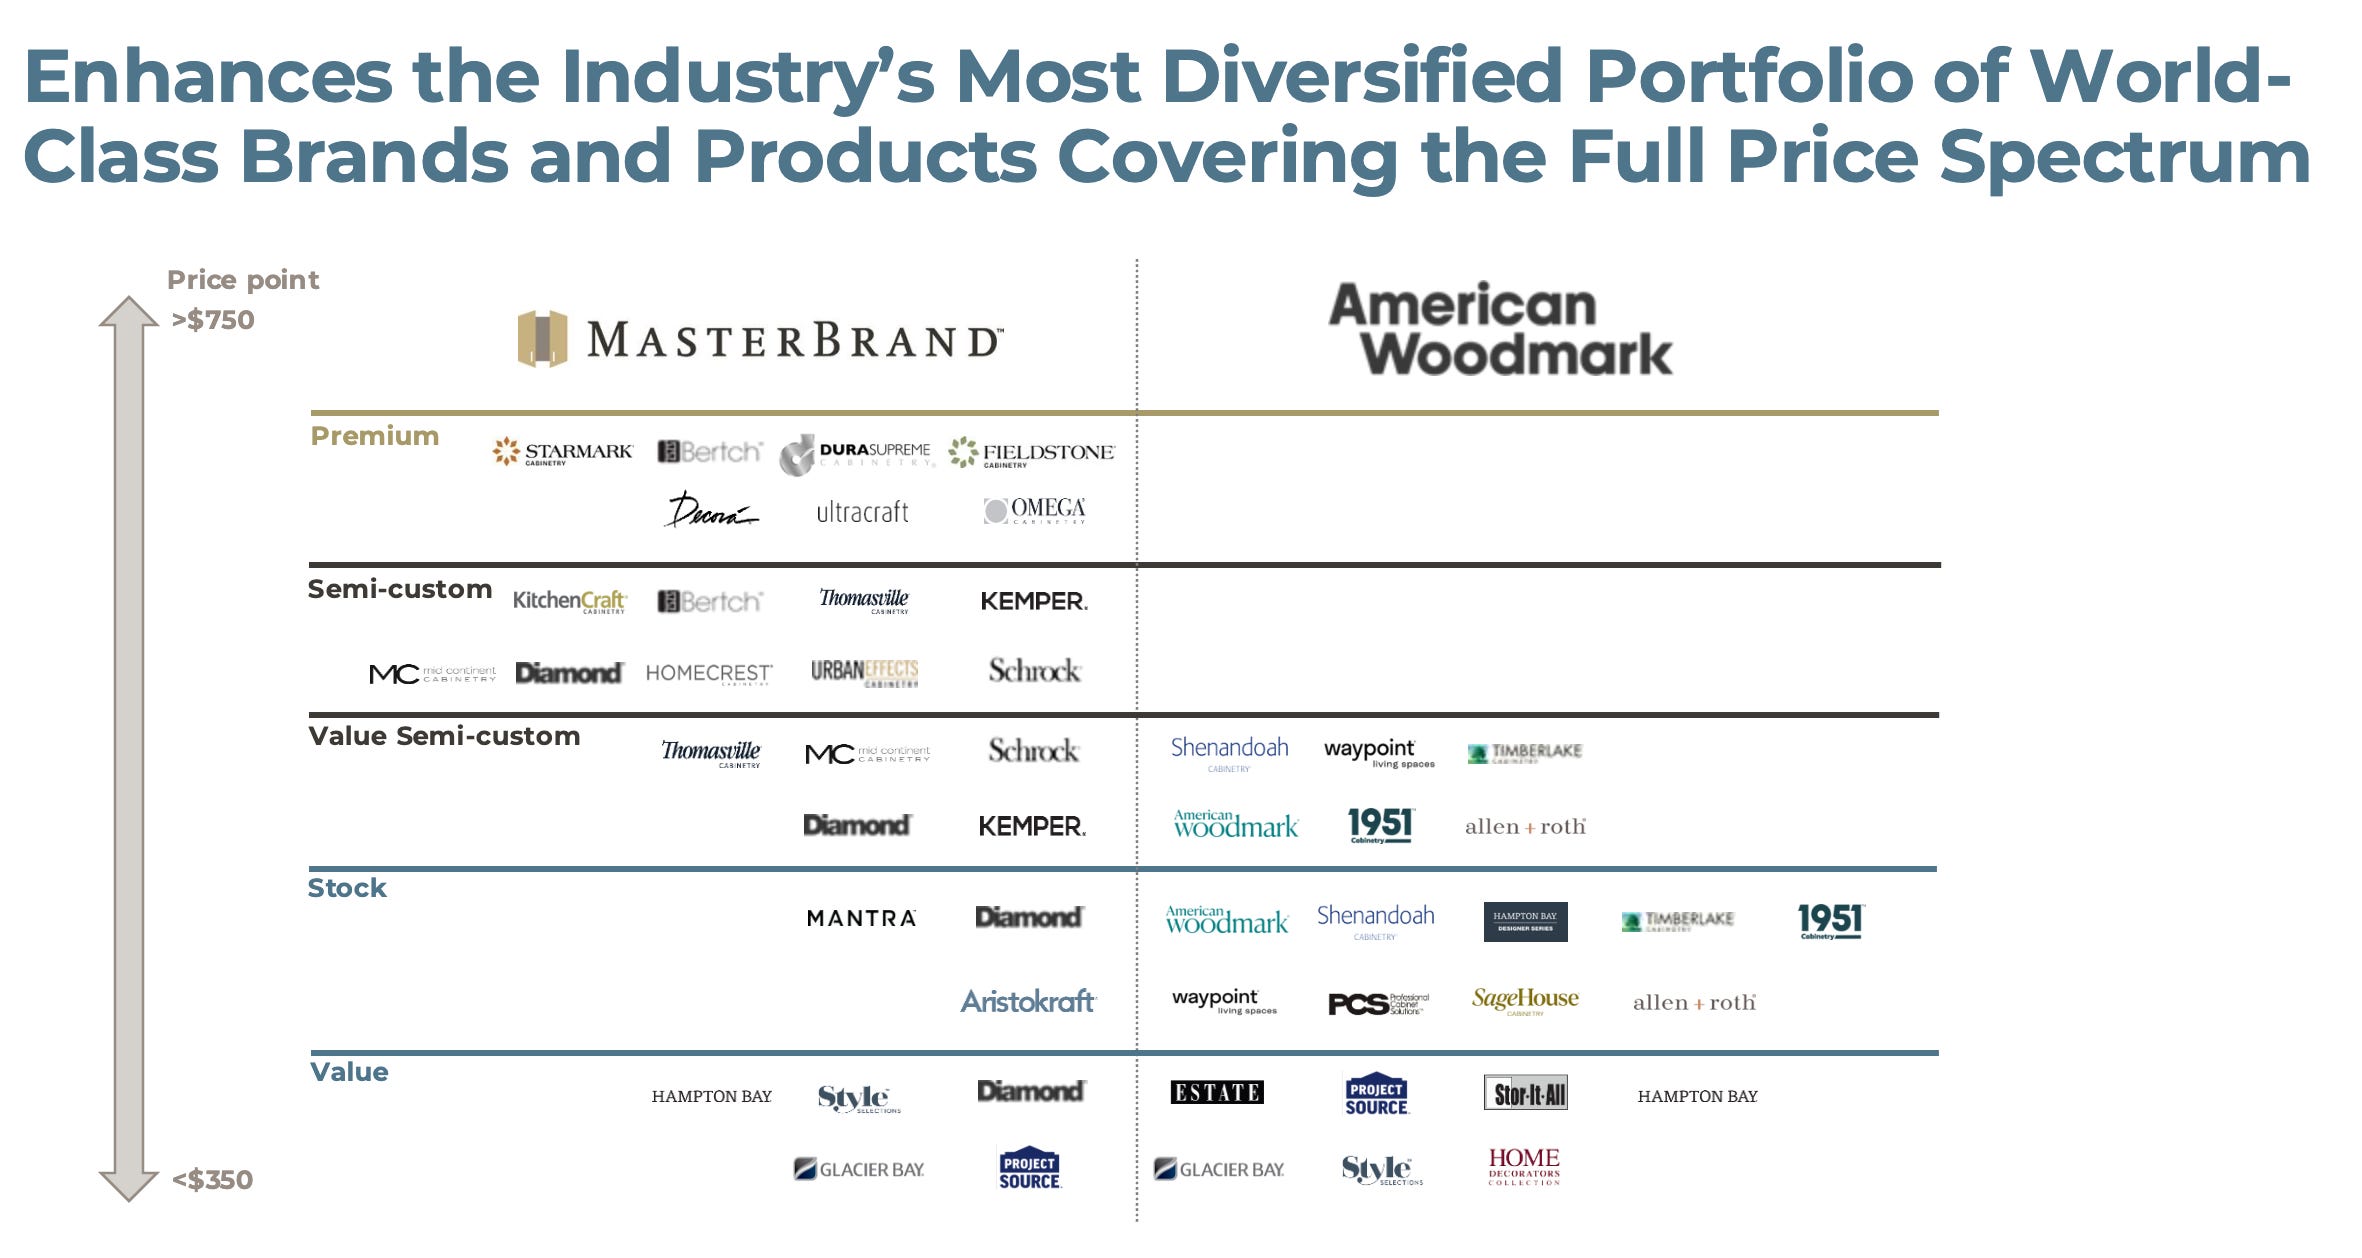
From a product standpoint, MBC leans premium price point while AMWD is on the value/stock end. Combined, they move from a moderately overlapping catalog to a full assortment of low-end, mid, and premium products.
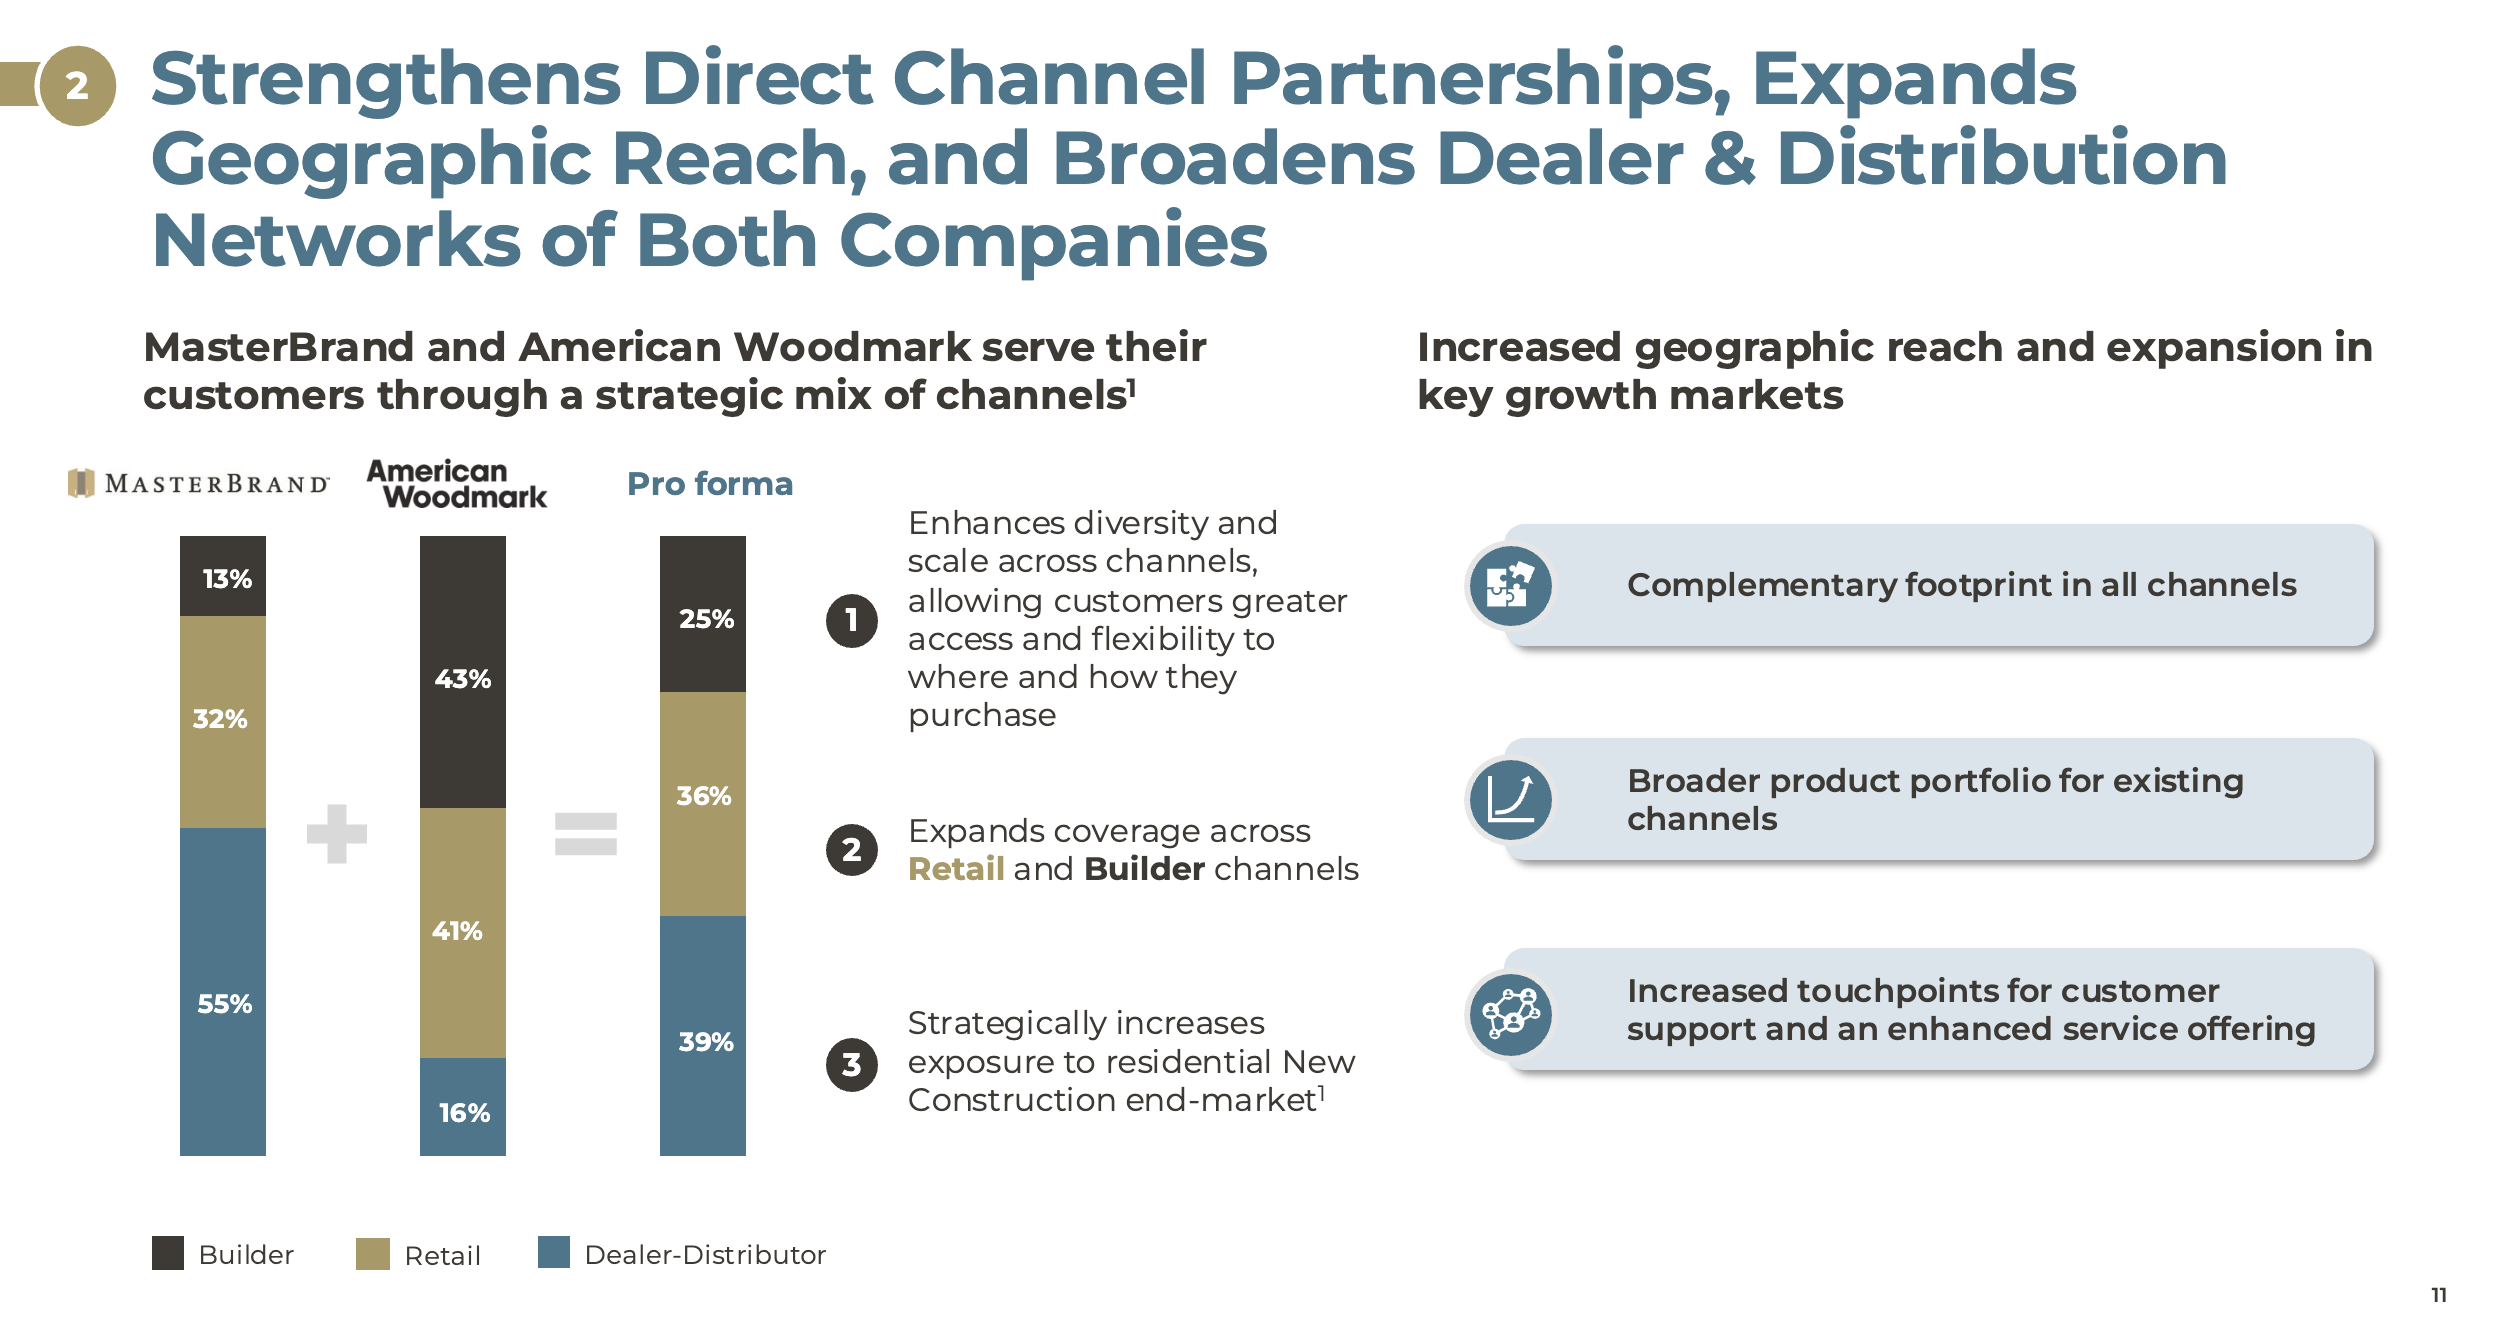
From a distribution standpoint, MBC was very dealer-centric while nearly half of AMWD sales came from the builder channel. Combined, this is a more balanced sales mix (25% builder, 36% retail, and 39% dealer):
Cost synergies are expected to total $90m over 3 years which is ~5% of the current market cap ($1.79bn) and ~29% of pro-forma 2026 EBITDA ($311m).
Half of the synergy goal is G&A related. None of these synergies include closing/consolidating manufacturing or distribution facilities. (As an aside, maybe this isn’t feasible if plants are dedicated to stock vs custom product lines?)
What I love most about this transaction is: (1) the all-stock nature which creates no added leverage; and (2) the cycle timing (both companies agreed to this near a bottom vs a top).
Why is that 2nd point important?
Few businesses are willing to sell themselves near the bottom of a cycle. This combination signals (to me at least) the importance of scale and a willingness to make hard decisions, especially on costs, during a cycle downturn.
Normalized earnings
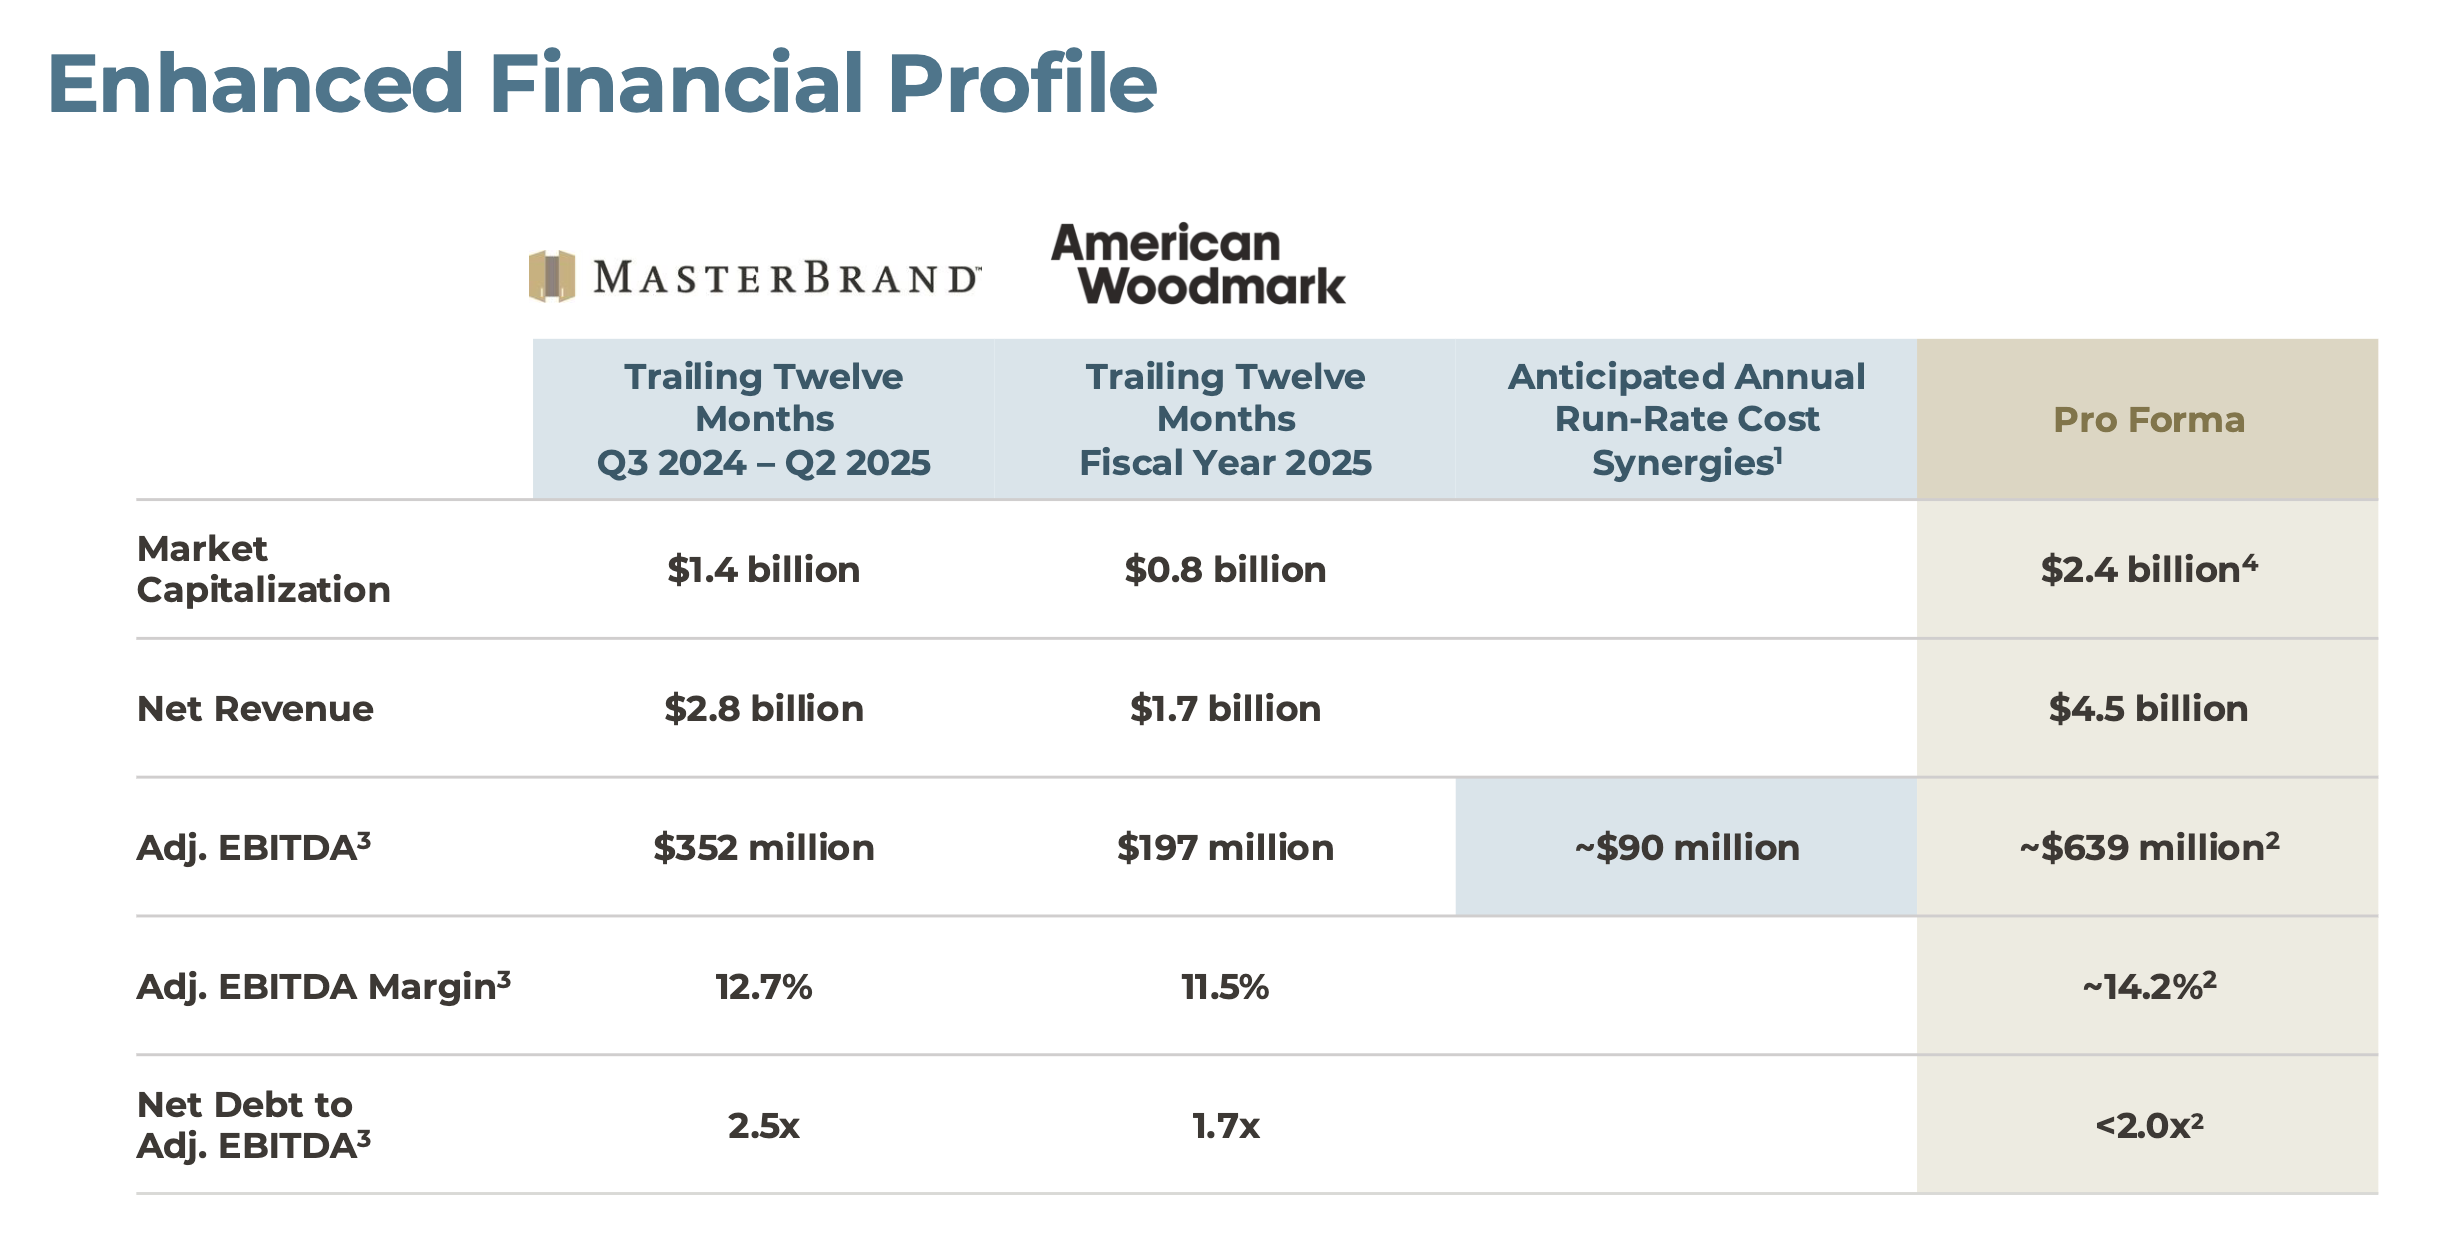
At the time the merger was announced, it was pitched as a combined ~$550m EBITDA business before synergies and $639m after synergies:
We’ve already seen the charts + commentary highlighting a challenging industry backdrop, so it shouldn’t be a surprise that fundamentals are deteriorating quickly here…
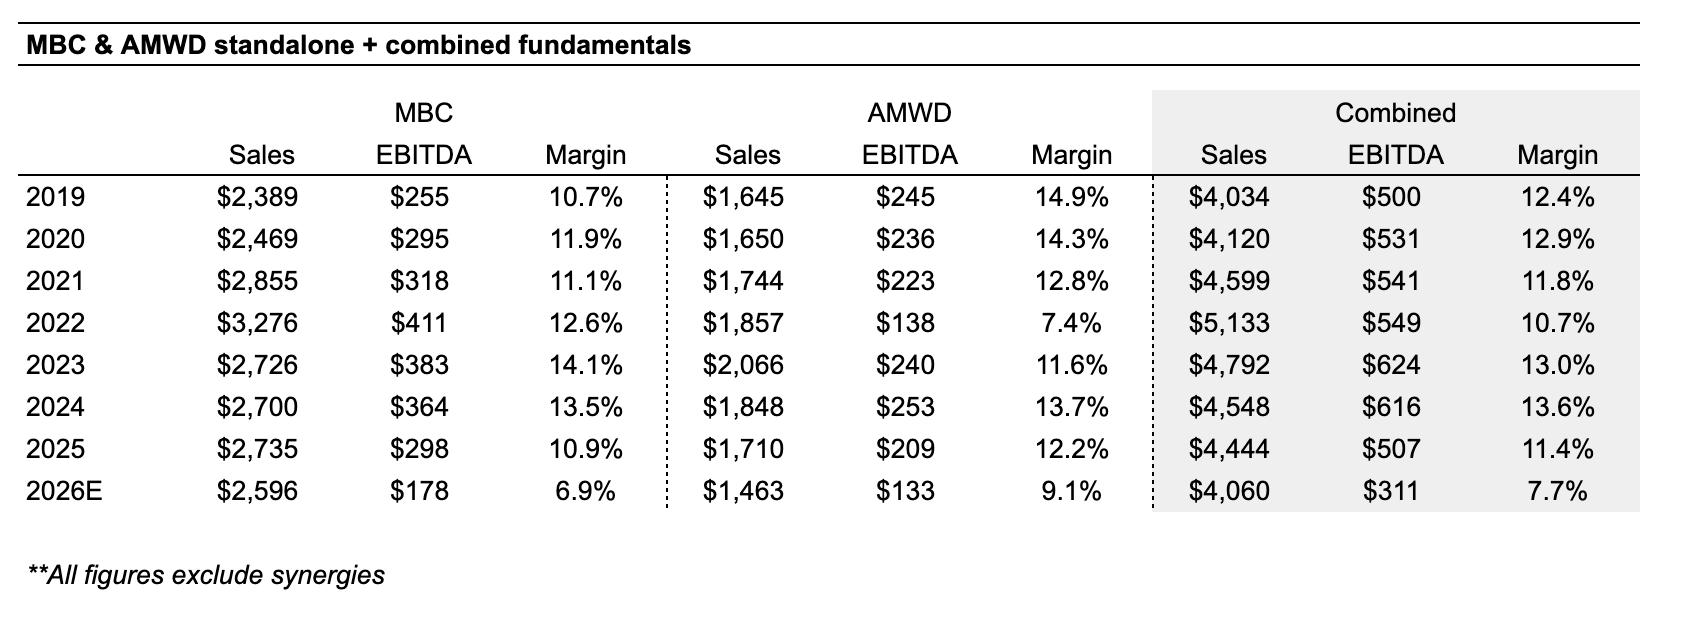
Using sell-side estimates for standalone MBC and standalone AMWD (as of May 2026), I see $311m combined EBITDA before synergies for 2026 (which is 44% lower than the $550m at time of announcement):
The big unanswered questions are:
Will 2026 represent the bottom?
What are earnings under “normal” market conditions?
Valuation
After closing, MBC has ~208m shares outstanding and trades at $8.50 = $1.77bn market cap. Net debt is $1.3bn as of Q1 2026, but includes a quarter of seasonal working capital outflows (i.e. net debt will likely be much lower by yearend 2026).
Since this is a cyclical business approaching an industry trough, a revenue multiple is probably most appropriate here…
There are 2 good comparisons: (1) Masco sold their cabinet business to what is now the #2 player, Cabinetworks, back in 2018 at 1.05x sales; and (2) AMWD historically traded at ~1x sales from 2014-2025.
Combined MBC/AMWD sales are expected to decline 8-9% in 2026 to $4.06bn. At 1x EV/sales = $2.76bn equity value or $13 per share (+53% upside).
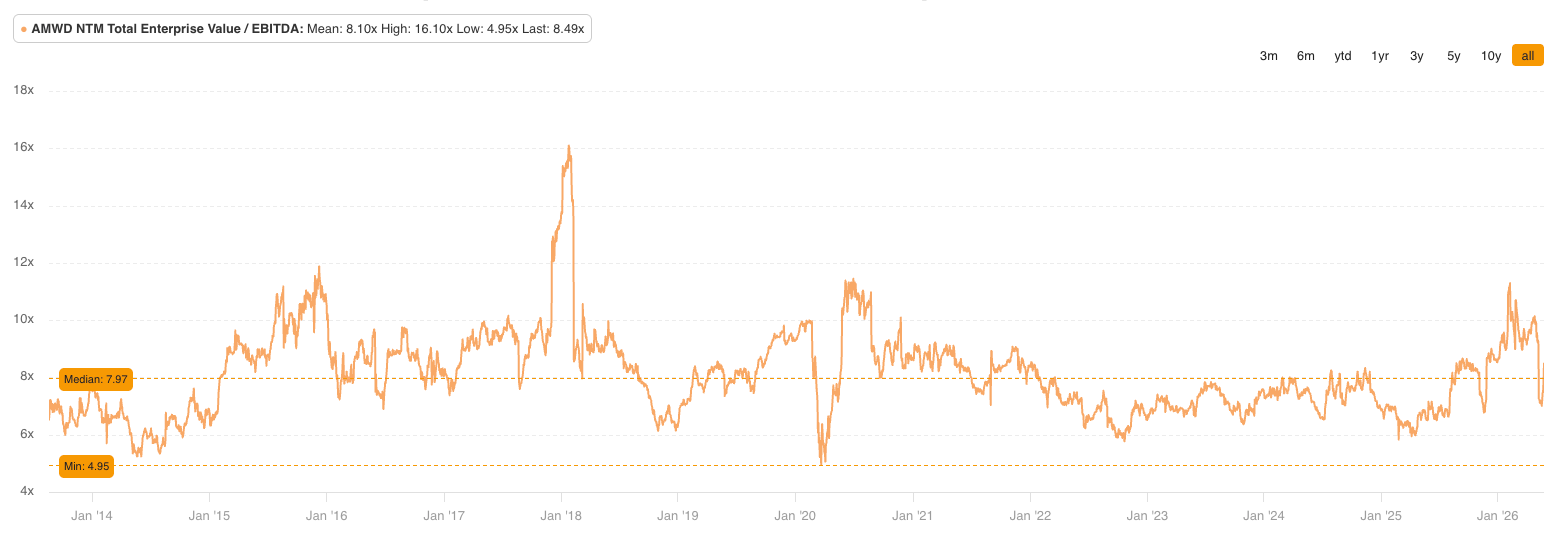
On the low-end, let’s use a trough EBITDA figure of $300m with zero credit for cost synergies. AMWD historically traded at a median 8x EBITDA multiple with a low of 5x.
I’ll use 8x trough EBITDA of $300m as a low-end valuation = $2.4bn enterprise value. This works out to a $1.1bn equity value or $5.30 per share (-38% downside).
Clearly the upside could be much greater with synergies and a housing recovery. A normalized EBITDA level is probably closer to $500m with another $50-75m synergies tacked on gets you $550-575m.
At 8x EBITDA = ~$4.5bn enterprise value or $3.2bn equity value. That’s more like $15-16 per share (80%+ upside) in a recovery scenario without any credit for deleveraging or 2026 cash flow.
Perhaps the upside/downside ratio is more than 2x here.
Summing it up…
I’m not ready to call a market bottom here, but I have been following a handful of housing-related names.
There are some serious tariff risks to this business, management is guiding to a 5-6% impact on gross sales which is nearly half of historic margins. They plan to reduce/eliminate this impact in 2026-2027, but there’s a chance it won’t cover everything.
Pzena had an April 2026 article calling for $1.50 per share in normalized earnings which puts the stock at a 5-6x earnings multiple in a recovery scenario. It’s not hard to paint an upside picture here.
This one is sitting on my watchlist for now. It looks like levered upside to housing & rates at the moment.
Disclosure: no position.
Resources: